Free Stock Charts & Live Trading Charts Explained
Every free stock chart shows you the same three raw ingredients — price, volume, and time — plotted so you can see how a security has moved. A live trading chart does the same job but updates continuously as new trades print, rather than refreshing on a delay or only once a day. The gap between what a free chart can show you and what you actually need to trade with confidence is where most self-directed traders get stuck: they can see a pattern forming, but they have no reliable way to turn that observation into a rule they can test and repeat. That gap is exactly what pushes traders from manually watching indicators toward tools like Quberas, which let you convert what you're already spotting on a chart into a visual, backtested strategy instead of a hunch you re-litigate every session.
What Is a Free Stock Chart, and How Do Live Trading Charts Actually Work?
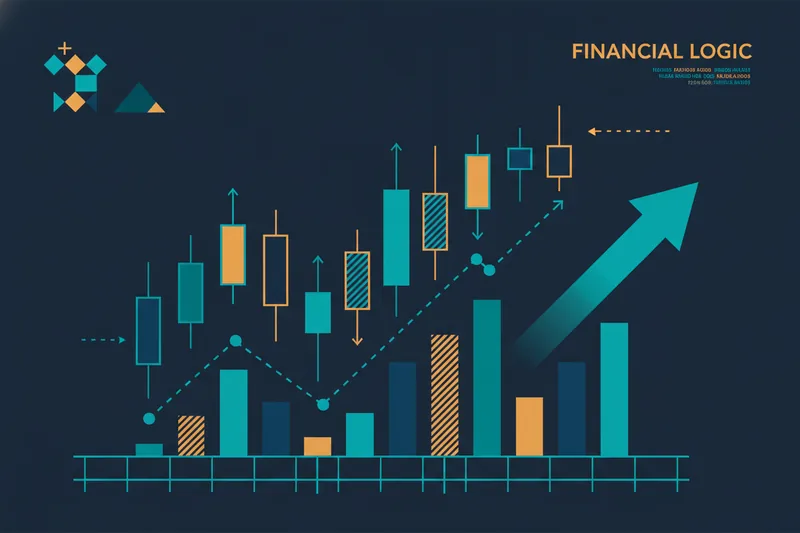
A stock chart is a plot of price over time, almost always rendered as OHLC/candlestick data — each bar or candle showing the open, high, low, and close for a given period, whether that's one minute or one month. Volume bars underneath show how many shares or contracts changed hands in that same window. Charting software is simply the application layer that pulls this data from an exchange or data vendor and renders it, along with tools to draw trendlines, apply indicators, and switch timeframes.
The difference between a static chart and a live one is update frequency. A free stock chart might reload once every few minutes or only at market close. A live trading chart streams tick-by-tick or near-tick updates, so the candle you're watching is still forming in real time. For a swing trader checking daily closes, that distinction barely matters. For anyone reacting to intraday moves, it's the whole game.
Free vs Real-Time/Delayed Data: What You Actually Get
The single most important thing to understand about free charting tools is that "free" and "real-time" are not the same promise. Most no-cost platforms provide delayed data — quotes and charts that lag the actual market by a fixed interval set by the exchange, rather than true real-time/live data. You'll typically see a small "delayed" label somewhere on the chart or watchlist; it's easy to miss if you're not looking for it.
This matters most on intraday charts — 1-minute, 5-minute, or 15-minute views — where a few minutes of lag can mean you're looking at a candle that's already been overtaken by new price action. On daily or weekly charts, delay is nearly irrelevant. If you're using live trading charts to time entries within a session, confirm whether your feed is genuinely real-time before you trust what you see on the screen.
What to Look for in a Free Stock Charting Platform
Before comparing named tools, it helps to fix the criteria you're judging them against. Day trading software is generally built around a few functional pillars — execution, data, and analysis — rather than a single all-in-one feature set, and free charting tools tend to specialize in the data/analysis piece rather than execution. When evaluating one, look at:
- Indicator depth — how many technical indicators are available, and whether you can stack multiple on one chart.
- Stock screener access — can you filter the market by price, volume, or indicator conditions, or only look at one symbol at a time?
- Data granularity — does the platform offer true intraday charts down to 1-minute bars, or only daily/weekly?
- Exportability — can you save chart layouts, export data, or is everything locked to the browser session?
These four criteria are what separate a tool you'll outgrow in a month from one that can carry you into more systematic trading.
Best Free Stock Chart Tools Compared
| Platform | Best known for | Data | Indicator depth |
|---|---|---|---|
| TradingView (free tier) | Large community, flexible charting UI | Delayed on many exchanges unless upgraded | Extensive built-in and custom scripts |
| StockCharts | Classic technical-analysis layouts | Real-time for US markets (BATS), delayed for other markets | Strong for longer-term chart patterns |
| Yahoo Finance | Broad market coverage, fundamentals alongside charts | Real-time streaming for many exchanges | Basic overlays |
| Investing.com | Cross-asset coverage (stocks, forex, crypto) | Delayed | Moderate |
| FreeStockCharts (FSC) | Lightweight, dedicated charting focus | Delayed | Solid core indicator set |
| ProRealTime | Detailed intraday charting for active traders | Real-time options depending on tier | Advanced indicator and screening tools |
| Finviz | Fast visual stock screener paired with charts | Delayed | Screener-first, charts secondary |
No single tool wins across every criterion. If you're screening the whole market for setups, Finviz's screener-first design is efficient. If you want to layer several indicators and study patterns closely, TradingView or ProRealTime give more room. StockCharts and FreeStockCharts suit traders who want a no-frills, chart-only workflow, and Yahoo Finance or Investing.com are fine as a quick reference alongside other research.
Free Stock Charts with Indicators
Most free charting platforms let you overlay standard technical indicators — moving averages, RSI, MACD, and volume bars — directly on the price chart. A moving average smooths price over a set period so you can judge trend direction; RSI measures how overbought or oversold a security looks; MACD compares two moving averages to flag momentum shifts. These are useful for spotting a setup visually.
The limitation is what happens after you spot it. Free charting software will show you where a moving average crossover occurred or where RSI dipped below 30, but it won't remember that condition, track how often it has led to a favorable move, or fire an alert the moment it happens again. You're left manually re-scanning the same indicators, chart after chart, session after session.
How to Read and Use Live Trading Charts
Reading a live chart well means separating signal from noise. Watch for the trend direction across your chosen timeframe, note where moving averages cross, and pay attention to volume spikes that confirm a move rather than just accompany it. Different trading styles operate on different windows — scalping typically works on 1-minute to 15-minute charts, where outcomes are shaped as much by execution speed as by the broader trend, while swing or trend trading looks at daily or weekly bars. Day trading itself spans several distinct approaches — range trading, breakout trading, gap trading, and momentum trading among them — and each reads the same chart differently.
The common trap on live charts is mistaking noise for a signal: a brief RSI dip, a single volume tick, or a near-miss on a moving average crossover that never actually confirms. Manually, it's genuinely hard to tell an "almost triggered" condition from a real one — you're pattern-matching in real time under pressure, which is exactly where consistency breaks down.
Free Charting Tools vs Algorithmic Trading Platforms
Chart-watching and algorithmic trading solve the same problem — deciding when to enter or exit — through different mechanisms. On a free chart, you see the pattern and act on it yourself. In algorithmic trading, the same pattern is expressed as a rule, and the rule triggers automatically once its conditions are met, without you re-checking the chart every few minutes.
A no-code strategy builder is what makes this shift approachable without programming: instead of writing conditional logic in code, you assemble it visually. A deal map lays out a strategy's stages — entry, averaging, exit, stop-loss — as connected steps you can inspect and adjust. A condition builder lets you combine price, indicator, volume, and crossover rules, including nested logic (e.g., "RSI below 30 AND price above the 50-day moving average"), the same conditions you'd otherwise be eyeballing manually on a live chart. The tools discussed so far in this article can be grouped broadly as full coding environments, no-code/low-code builders, signal-to-execution layers, or pre-built strategy marketplaces — free charting platforms sit outside all four, since they show you data but don't act on it.
Limitations of Free Stock Charts (and When to Upgrade to Automation)
Free stock charts have a hard ceiling: they can't run a backtest, meaning they can't show you how a rule would have performed across months or years of historical data before you risk real capital. They also can't apply a visual debugger — highlighting exactly which chart zone caused a condition to fire, or how close a near-miss came to triggering — which is how you catch false signals before they cost you money rather than after.
They're similarly silent on execution-level risk management: a free chart won't enforce a stop-loss, size a position, or apply risk controls at the trade level. Those all require a system sitting between your analysis and your order, watching continuously in a way manual chart review can't match. When you find yourself re-checking the same indicator setup daily and still second-guessing entries, that's the point at which a charting tool has done its job and a rule-based system becomes the more accurate next step.
FAQ
What is a good free trading chart platform? It depends on what you need most: TradingView and ProRealTime suit traders who want deep indicator layering, Finviz suits market-wide screening, and StockCharts or FreeStockCharts suit a simpler, chart-only workflow.
Are live trading charts accurate? The candles and volume shown are accurate to the data feed powering them, but "accurate" doesn't mean "current" — many free feeds are delayed, so confirm whether your platform provides real-time or delayed data before trading intraday off it.
Can I automate a strategy from a free chart? Not directly. Free stock charts display patterns and indicator readings but have no mechanism to test a rule historically or execute it live; turning what you see into an automated strategy requires a separate no-code or coded platform built for that purpose.
Do free stock charts support technical indicators? Most do, at least in a basic form — moving averages, RSI, MACD, and volume overlays are standard even on no-cost tiers, though advanced indicator libraries and custom scripting are often reserved for paid plans.
If you've been tracking the same crossovers and RSI dips on a free chart and want to see whether they actually hold up, try Quberas free to turn the indicators and patterns you already track into a visual, backtested trading strategy — no coding required.