What Is an Order Block in Trading? Definition & Types
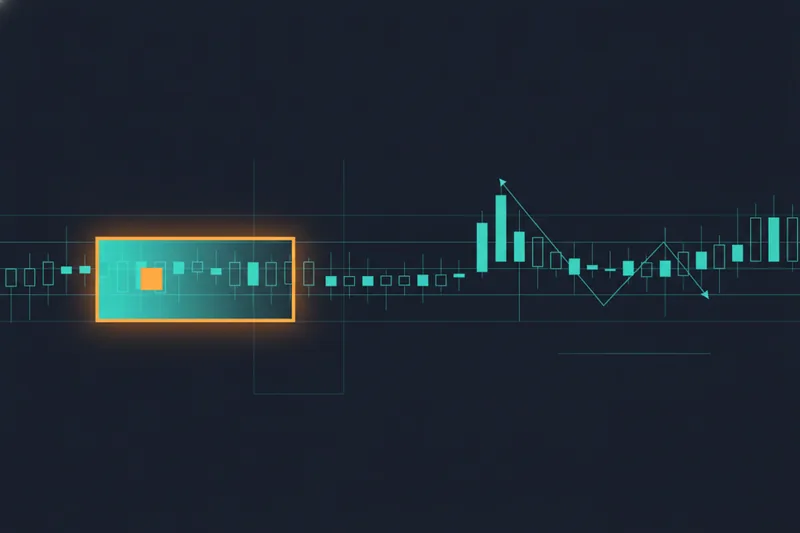
An order block is a concept from order block trading, referring to a specific candle, or short cluster of candles, that price-action traders mark as the last point of consolidation before a strong, sustained move in one direction. The logic behind it is that a move that sharp needed more volume than one retail order could supply, so the zone is treated as a footprint of institutional order flow — the buying or selling done by funds, market makers, and other large players whose size forces them to fill orders across a range of prices rather than in a single trade. When price later returns to that same candle's range, traders watch to see whether the same imbalance reasserts itself and pushes price away again.
The term comes out of ICT (Inner Circle Trading) concepts, a body of price-action ideas built around the premise that retail charts still show traces of how large participants accumulate and distribute positions. An order block is one building block of that framework, sitting alongside ideas like liquidity grabs and market structure shifts. None of this is unique to one market — the same logic gets applied to forex pairs, indices, and crypto charts alike — but it remains a way of reading a chart, not a measurable fact about who actually traded there.
How Order Blocks Form in Market Structure
The mechanical definition is narrow: an order block is the last opposing candle before an impulsive move. In an uptrend scenario, that means the final bearish candle — the last red candle — printed immediately before price breaks higher with noticeably larger range or momentum than the candles around it. In a downtrend scenario, it is the last bullish candle before a sharp drop. The candle itself does not need to look unusual; what marks it as an order block is what happens right after it.
The reasoning traders give for this is institutional accumulation: a large buyer needing to acquire size without moving the market too early will often do so during a quiet, rangebound candle, then let the position run once enough size is filled. Whether that is literally what happened on any given candle can't be confirmed from price data alone — it's an inference, not a certainty.
The role of a market structure shift
Order blocks are usually identified in the context of a market structure shift, sometimes called a change of character. This is the point where price breaks the prevailing sequence of higher highs and higher lows (in an uptrend) or lower highs and lower lows (in a downtrend), signaling that the short-term trend may be turning. Traders typically only treat a candle as a meaningful order block if it sits just before this kind of structural break, rather than before an ordinary swing.
How a liquidity grab precedes formation
Many order block setups are preceded by a liquidity grab: price pushes briefly beyond a recent swing high or low — a level where stop-loss orders and breakout entries tend to cluster — before reversing hard in the other direction. The idea is that this spike clears out resting orders and provides the volume needed to fuel the subsequent move, with the order block forming in the candles right after the grab.
Bullish and Bearish Order Blocks on a Chart
A bullish order block is the last down candle printed before price reverses and rallies strongly. Picture a range where price has been drifting lower, prints one final red candle, then immediately turns and breaks away to the upside with visibly larger candles. The range of that last red candle becomes the order block. When price retraces back down into that zone later, the setup traders watch for is a reaction — buying pressure reappearing and price turning back up from that same range, treating it as a demand area.
A bearish order block works in mirror image: it's the last up candle before a sharp decline. If price has been grinding higher, prints one final green candle, then drops away with momentum, that last green candle's range marks the bearish order block. A later return to that zone is watched for a rejection back downward, with the zone acting as supply.
In both cases, the order block only gets confirmed after the fact — nobody marks it in real time with certainty, because the "strong move" that validates it hasn't happened yet while the candle is forming. That lag is one reason two traders looking at the same chart can disagree on which candle actually qualifies.
Order Blocks vs. Breaker Blocks, Supply/Demand Zones, and Fair Value Gaps
The order block sits in a cluster of related ideas that are easy to conflate. Separating them clarifies what each one is actually claiming about the chart.
Order block vs breaker block
A breaker block is what an order block becomes once it fails. If price returns to a bullish order block and, instead of reacting upward, breaks straight through it, that zone is considered to have flipped roles: the old demand zone is relabeled a breaker and is now watched as potential resistance on the next approach. In other words, a breaker block isn't a separate kind of candle to find — it's an order block that didn't hold, reinterpreted after the fact.
Order block vs supply/demand zone
Supply and demand zones are the older, broader version of the same idea from classical technical analysis: areas where buying or selling pressure previously overwhelmed the other side, drawn as a range rather than pinned to one candle. An order block is a more specific, ICT-flavored variant of the same concept — it insists on the last-opposing-candle definition and ties the zone to a structural break, where a supply or demand zone is often drawn more loosely around an entire consolidation area.
Order block vs fair value gap
A fair value gap is a different kind of marker entirely. It's the visible gap left across three candles when price moves so fast that the trading ranges don't overlap — a space where little or no trading actually occurred at those prices. An order block marks where a move is believed to have started; a fair value gap marks a stretch of price the move jumped over. They often appear on the same impulsive leg, which is why they're frequently discussed together, but one describes an origin point and the other describes an inefficiency left behind.
Where the Order Block Concept Breaks Down
The clearest limit of order block analysis is that it offers no guarantee. Price frequently returns to a marked zone and simply cuts through it without the expected reaction, especially in choppy or low-volume conditions where there was never a strong institutional move to begin with — just an ordinary candle that happened to precede some follow-through.
The bigger issue is subjectivity. There's no fixed rule for exactly which candle qualifies once a move is underway, how large the following move needs to be, or how far price has to travel before a structure shift counts as confirmed. Two traders marking the same chart will often draw the zone at slightly different candles, and both can defend their choice. That variability is also why order blocks are hard to test rigorously: a rule that depends on a human judgment call doesn't translate cleanly into a fixed, repeatable condition. In building visual tools for testing rule-based strategies at Quberas, this shows up constantly — a zone a trader calls "valid" and one they'd call a "near miss" often sit only a candle or two apart, and reducing that gap to a precise, consistent rule takes more work than the concept's informal explanations suggest.
None of this makes the concept useless — it describes a real, recognizable price pattern — but it means an order block is a way of framing a possible reaction zone, not a signal with a fixed success rate or a mechanical trigger that behaves the same way on every chart.