Is Price Action Trading Reliable? When It Works
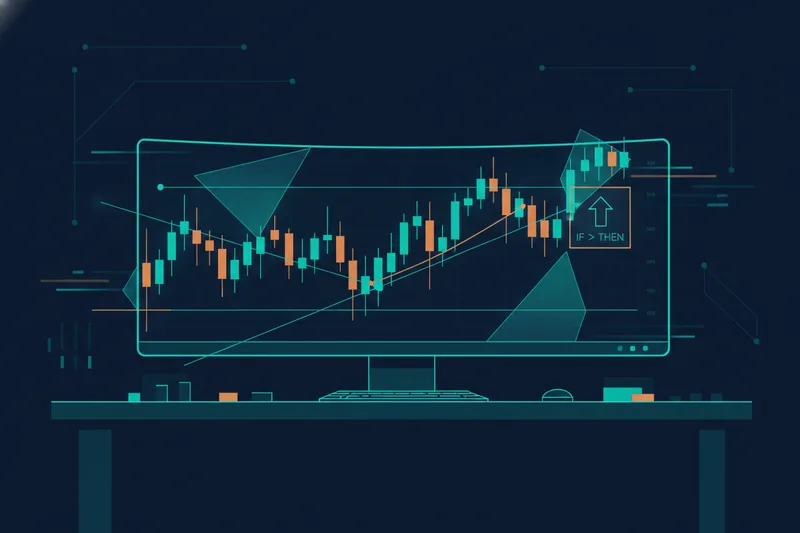
Price action trading is reliable only when the patterns it relies on — support and resistance levels, market structure shifts, trend lines, candlestick and chart formations — are written down as specific, testable rules and proven against historical data; read subjectively off a live chart, the same patterns are a shaky basis for a strategy. Price action trading itself is simply the practice of making decisions from the raw movement of price rather than from derived indicators: where highs and lows cluster (support and resistance), how the market is organizing itself into higher highs and higher lows or the reverse (market structure), the direction price is leaning (trend lines), and the recurring shapes candles and multi-bar formations make (candlestick and chart patterns). Used as a discipline — codify a pattern into an if-then condition, then test it — the approach holds up. Used as a discretionary art, where a trader "reads" the chart in the moment and acts on a feeling that a shape means something, it does not, because the same chart invites multiple contradictory readings and a trader tends to notice only the ones that confirm what they already believed.
When Price Action Trading Makes Sense
Price action holds up best in liquid, trending markets where volume is high enough that support, resistance, and trend lines reflect real buying and selling pressure rather than a handful of thin orders. In those conditions, market structure tends to be clean: higher highs and higher lows, or the mirror image in a downtrend, show up with enough regularity that a level or a trend line break means something more often than not.
It also requires the trader to apply the same rule every time its conditions are met, not just when it feels right. A trader who defines a breakout as, say, a close above resistance on volume at least 1.5 times the recent average, and takes that signal every single time, gets a fair test of whether the pattern works. One who takes it sometimes and skips it other times based on gut feel never actually tests the rule at all. Built this way, price action becomes one disciplined approach among several — not inherently superior to range, trend, gap, or breakout trading built on other logic, just a different lens on the same price data.
When Price Action Trading Does Not Work
Price action tends to fail in choppy, low-liquidity conditions, where price oscillates without a clear trend and support and resistance levels are more noise than signal — a breakout in a thin market can reverse within minutes because there wasn't enough real volume behind it. It also fails whenever the "rules" being applied were never actually tested: a trader who has only ever eyeballed a handful of charts and concluded that a pattern usually works has an impression, not evidence.
The deeper failure mode is confirmation bias — the tendency to notice the times a pattern led to a clean move and discount the times it didn't, because a mental tally of outcomes is far less reliable than it feels. Subjective pattern-reading is particularly exposed to this: two traders can look at the same candlestick formation and reach opposite conclusions, both convinced they're reading what the chart is telling them. None of this means price action concepts are invalid; it means that without writing the pattern down as an explicit condition and checking it against history, a trader cannot tell the difference between a real edge and a story told after the fact.
Price Action vs Indicator-Based Trading: A Fair Comparison
Indicator-based trading adds a computed layer — moving averages, oscillators, volume-derived signals — on top of price, trading the derived number rather than the raw chart. Naked chart trading, the price-action-only approach with no indicators overlaid, strips that back to just price, volume, and the levels and structure a trader draws in.
Neither is categorically better. Indicators smooth out noise and give a consistent, repeatable number to test a rule against, which is part of why the broader toolset around automated trading has grown to include everything from full coding environments to no-code builders, signal-relay services, and marketplaces of pre-built strategies. Naked price action keeps a trader closer to raw supply and demand, but that same closeness is what makes it easier to rationalize a loss as "the pattern almost worked." In practice, most systematic traders treat the two as complementary rather than exclusive: price action defines where a setup exists — a level, a structure break — and an indicator, or a backtested statistical filter, confirms whether that setup has actually paid off historically before it's traded live. The sound comparison isn't which approach is right, but which rules, from either camp, have been written down and tested, and which haven't.
What Actually Determines Whether a Price Action Strategy Is Viable
Spotting a pattern is the easy part; proving it holds up statistically is what actually decides whether a price action strategy is viable.
Why pattern recognition alone is not enough
Knowing that a double top or a trend line break looks right is a separate question from knowing whether that specific definition of the pattern has produced more winning trades than losing ones. Answering that requires backtesting — running the exact rule against historical price data — followed by forward testing on fresh, out-of-sample data, since a rule that only looks good on the data it was built on says little about what it will do next. Traders who backtest a rule before going live tend to have a clearer sense of what a normal losing streak looks like for that rule, which generally makes them less likely to abandon it prematurely after a run of losses.
Sample size and statistical confidence
A handful of trades, however good they look, is an anecdote rather than evidence. Confidence grows with the number of independent signals a rule has produced, not with how clean a short equity curve looks. As a common rule of thumb among traders and analysts, a Sharpe ratio — a measure of return relative to volatility — above roughly 1.0 is often considered acceptable, above 2.0 good, and above 3.0 excellent, though these are informal benchmarks rather than fixed standards, and they mean little on a small sample. Risk management — position size, stop placement, maximum concurrent exposure — has to be tested as part of the rule itself, since changing any of it changes what the backtest actually measured.
The Rule to Apply Before Trading Any Price Action Pattern
The single rule that separates a workable price action approach from guesswork: never trade a pattern live until it is written as an explicit if-then condition and tested against historical data first. "Price tends to bounce off this level" is not a rule; "enter long when price closes within 0.1% of a level touched at least twice before, with a stop below the prior swing low" is. Define the entry, the invalidation point, and the exit before a single dollar is risked, then check how that exact rule would have performed over a meaningful stretch of history.
Risk rules belong in that same definition, not as an afterthought. Commonly cited rules of thumb range from capping risk at 1-3% on any single trade, limiting total exposure across open positions to around 5-10%, and favoring setups with a profit-to-loss ratio of several multiples to one before a trade is taken at all — the specific numbers vary by source and trading style, but the habit of fixing them in advance is what matters. Either way, the test has to come before the trade, not after.
Common Questions About Price Action Trading
Is price action trading just guesswork? Not inherently — the guesswork comes from skipping the step of defining and testing the pattern, not from using price instead of indicators.
What's the most common mistake? Treating a handful of winning trades as proof, then risking real size before the rule has been checked against a larger sample.