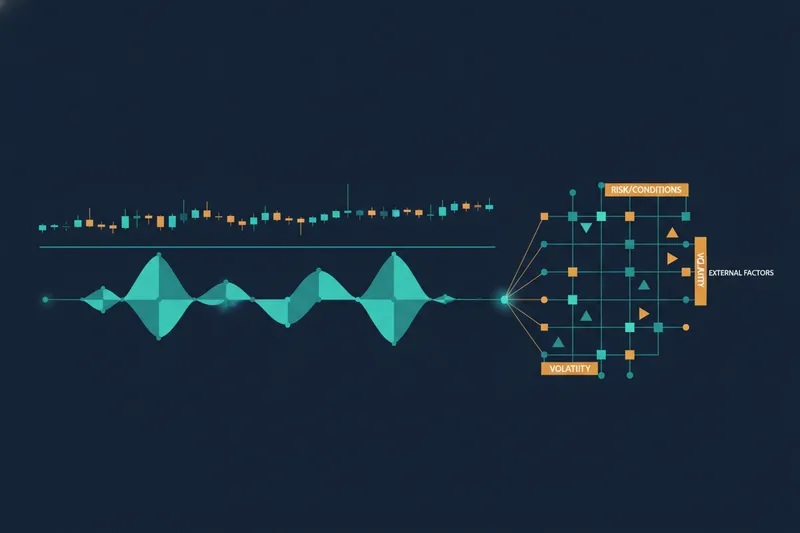
What Is Trading Volatility? Definition & How It Works
What Volatility Trading Actually Means
Trading volatility means taking a position based on how much a price is expected to move, rather than on which direction it moves. A trader who buys a stock because they expect it to rise is making a directional bet: they're right if the price goes up and wrong if it goes down. A trader who buys volatility is betting on the size of the swing itself — they can be right even if the price ends up roughly where it started, as long as it moved enough along the way, and they can lose even on a rally if that rally turns out calmer than priced in.
This distinction matters because it changes what "being right" means. Directional trading rewards correctly predicting up or down. Volatility trading rewards correctly predicting calm or turbulence — and the instruments used to express that view (options, VIX-linked products, or rules built around how far price has stretched from its average) are priced around expected movement, not expected direction. A trader can have no opinion at all on whether an asset will rise or fall and still take a volatility position purely on the conviction that the market is underpricing or overpricing how much it's about to swing.
That's the core idea the rest of this explainer builds on: volatility trading is a separate axis from the up/down calls most retail traders start with, and it requires a different way of reading the market.
How Volatility Trading Works: Measuring and Exploiting Price Swings
Volatility itself has two faces, and the gap between them is where the trading opportunity lives.
Historical vs Implied Volatility
Historical volatility (sometimes called realized volatility) measures how much an asset's price actually moved over a past period — calculated from the standard deviation of its returns. It's backward-looking: a fact about what already happened.
Implied volatility is forward-looking. It's derived from options prices and reflects what the market currently expects future price swings to look like over the life of the contract. Implied volatility isn't a measurement of movement that already occurred; it's a consensus guess, baked into what traders are willing to pay for optionality.
These two numbers rarely agree for long. Implied volatility can run higher than what later turns out to be realized — options buyers paying for turbulence that doesn't show up — or lower, when the market underestimates how rough things are about to get.
Why the Gap Creates Tradable Opportunities
The gap between implied and historical volatility is the raw material of volatility trading. When implied volatility sits well above what an asset has actually been realizing, some traders treat that as overpriced fear and look for it to mean revert — the statistical tendency for volatility to drift back toward its longer-run average after spiking, rather than staying elevated indefinitely. When implied volatility looks cheap relative to recent realized moves, others take the other side, positioning for volatility to expand.
This isn't limited to mean reversion. Volatility also moves because the market's underlying regime changes — a stretch of low-volatility drift giving way to a higher-volatility regime around earnings, macro data, or a liquidity shock. Mispricing and regime shifts are two different sources of edge: one is a bet that volatility snaps back to normal, the other is a bet that "normal" has changed.
None of this is free to act on. Execution matters: retail brokers can mark up prices beyond the raw bid-ask spread, and that cost eats directly into an edge that, by definition, is usually a few percentage points of mispriced expectation rather than a large directional move.
An Example: Volatility Rising and Falling
Consider a crypto asset moving through one of its periodic cycles. Bitcoin's market cycles — from a bull-market top to the following bear-market low — have historically repeated on roughly four-year intervals, and each cycle carries a distinct volatility signature rather than a flat level of "risk." This four-year pattern is a widely observed tendency rather than a guaranteed or mechanically proven cycle, and past repetition doesn't ensure it continues.
During the run-up into a cycle top, realized volatility often climbs as price makes fast, large moves in both directions — sharp rallies punctuated by violent pullbacks. A trader reading volatility as a tradable factor isn't trying to call the next 20% move; they're noting that the size of daily swings has expanded well beyond what the past several months showed, and positioning for that elevated-volatility regime to persist or options pricing to catch up to it.
Contraction tells the opposite story. After a cycle bottoms out and price enters a long accumulation range, daily swings compress — the asset trades in a tighter band, and realized volatility drifts down toward multi-month lows. A trader who had positioned for turbulence now faces a market that's gone quiet; a volatility position built on the expectation of continued large swings decays in value even if the underlying price direction was never wrong.
The point of the example isn't the specific asset — it's that volatility itself has a visible rise-and-fall pattern distinct from price direction, and reacting to that pattern, rather than to where price is headed, is what separates this approach from ordinary directional trading.
The Main Categories of Volatility Strategies
Volatility trading isn't one strategy; it's a family of approaches built around different ways of expressing a view on price movement.
Options-based strategies use combinations of calls and puts — structures like straddles or strangles — to profit from how much an asset moves rather than which way. Their pricing is also shaped by volatility skew: the tendency for implied volatility to differ across strike prices, typically running higher for out-of-the-money puts than calls, because the market tends to price downside shocks more richly than equivalent upside moves. Skew is part of why two options that look similar on paper can carry very different volatility assumptions.
VIX-based strategies trade instruments tied to an index-level volatility measure — the VIX, calculated from S&P 500 option prices and often described as the market's "fear gauge." These let a trader take a view on broad market turbulence without picking individual stocks.
Mean-reversion strategies bet that volatility, after stretching away from its average, pulls back toward it — the same mechanism described earlier, applied as a rule rather than a one-off read.
Breakout strategies take the opposite stance: instead of fading an expansion in volatility, they position for it to continue, entering when price breaks decisively out of a tight, low-volatility range on the view that the move has further to run.
These categories aren't mutually exclusive — a single trader might combine a VIX-based hedge with an options structure around an earnings date — but understanding them as separate tools, each suited to a different volatility hypothesis, is what keeps "trading volatility" from collapsing into a vague catch-all.
Risks, Limits, and When Volatility Trading Stops Making Sense
Volatility trading carries risks that are different in character from directional trading, not just different in degree.
Timing risk is sharper here: being right about direction eventually but wrong about when volatility expands or contracts can still lose money, because many of the instruments used — especially options — have a built-in expiration. Decay works against a position even when the underlying thesis is correct but slow to play out; an option bought for an expected volatility expansion loses value with each day that expansion doesn't arrive.
Model risk is real because implied volatility, skew, and the models used to read them are estimates, not facts — a model that's miscalibrated to current conditions can make a cheap-looking position look expensive, or vice versa. And some structures carry genuinely unlimited loss scenarios, particularly uncovered options positions, where being wrong about the size of a move can cost far more than the position's nominal size suggests.
Because of this, traders who pursue volatility strategies typically apply disciplined, firm risk-sizing limits on individual trades and overall exposure, and they test an idea against historical and live data before trusting it. A Sharpe ratio — a measure of return relative to the volatility of that return — above roughly 1.0 is often treated by some traders as a rough rule-of-thumb for acceptable performance, and above 2.0 as strong, though this heuristic isn't a fixed or universally accepted threshold, a useful sanity check against strategies that look good only because they took outsized risk.
Volatility trading stops making sense for a trader who can't tolerate decay working against a correct-but-early thesis, who can't size positions to survive a wrong call on an unlimited-loss structure, or who wants a direct read on an asset's direction rather than on how far it might move.
Common Questions About Trading Volatility
Is trading volatility profitable? It can produce an edge when the gap between implied and historical volatility is real and large enough to cover execution costs, but it isn't inherently more or less profitable than directional trading — it trades one set of risks (decay, model error, sizing) for another, and results vary by strategy, instrument, and market regime rather than following a fixed formula.
Which volatility measure should a trader watch? For broad market conditions, the VIX is the most commonly referenced gauge; for an individual position, the more useful comparison is usually that asset's own implied volatility against its recent historical volatility, since that gap is what the trade is actually built on.