What Is Pairs Trading? Strategy Explained
Pairs trading is a market-neutral strategy: a trader holds a long position in one asset and a short position in a second, historically related asset at the same time, betting on the relationship between their prices rather than on either one going up or down. The profit comes from the spread — the price gap between the two — narrowing back toward its historical norm after it has stretched unusually wide. Understanding why that gap opens and closes matters far more than memorizing a formula, because the formula only works when the underlying relationship between the two assets actually holds.
What Is Pairs Trading?
A pairs trade is built from two legs: buy the asset that looks relatively cheap, sell short the one that looks relatively expensive, and size both positions so the trade's value is roughly balanced. If the market as a whole rallies or falls, the long and short legs move together and largely cancel each other out — that's what makes it a market-neutral strategy. The trade only makes or loses money on the difference between the two prices, not on the direction of the broader market.
This distinguishes pairs trading from most retail strategies, which bet on a single asset's direction. Here, the thesis is narrower and arguably more testable: two assets that have historically moved together have temporarily drifted apart, and the trader is wagering that they will converge again. When they do, the long position gains relative to the short, or the short gains relative to the long, and the combined position profits regardless of whether the broader market went up or down in the meantime. The strategy originated on institutional desks decades ago and has since become accessible to retail and semi-professional traders working with stocks, ETFs, futures, and increasingly crypto assets.
Correlation vs. Cointegration: Choosing a Valid Pair
Picking a pair is the part of the process most traders get wrong, usually by confusing two different statistical ideas: correlation and cointegration.
Correlation measures how closely two assets move together over a given period — a high correlation means their returns tend to rise and fall in tandem. But correlation is a short-term, return-based measure. Two assets can be highly correlated for months and then drift apart permanently, especially if the correlation was driven by a shared macro trend rather than a structural link between the businesses or markets themselves.
Cointegration is a different, stronger property: it says that even though the two prices may each wander widely on their own, the spread between them tends to stay within a stable range over the long run and pulls back when it strays. Two cointegrated assets don't need to move together day to day — they need a long-term equilibrium relationship that reasserts itself. This is the property pairs trading actually depends on, because the entire strategy rests on the spread reverting, not on the two prices tracking each other tick for tick.
In practice, this means a pair with high correlation but no cointegration is a trap: it looks like a clean pairs trade until the spread diverges and simply never comes back, because there was never a structural reason for it to. Traders who build pairs strategies around correlation alone are often really making a direction bet in disguise.
The Mechanics: Spread, Mean Reversion, and Z-Score Signals
Once a pair is chosen, the trade is managed through the spread — typically the price of one asset minus the price of the other, scaled by a ratio that reflects their relative volatility or historical price levels. The spread is the single number the strategy watches; everything else is a function of how that number behaves over time.
The strategy assumes mean reversion: that the spread fluctuates around a long-run average and that large deviations from that average are more likely to shrink than to grow further. This assumption is the whole premise of pairs trading, and it's also its biggest vulnerability, because mean reversion is a statistical tendency observed in the past, not a guaranteed law of the market going forward.
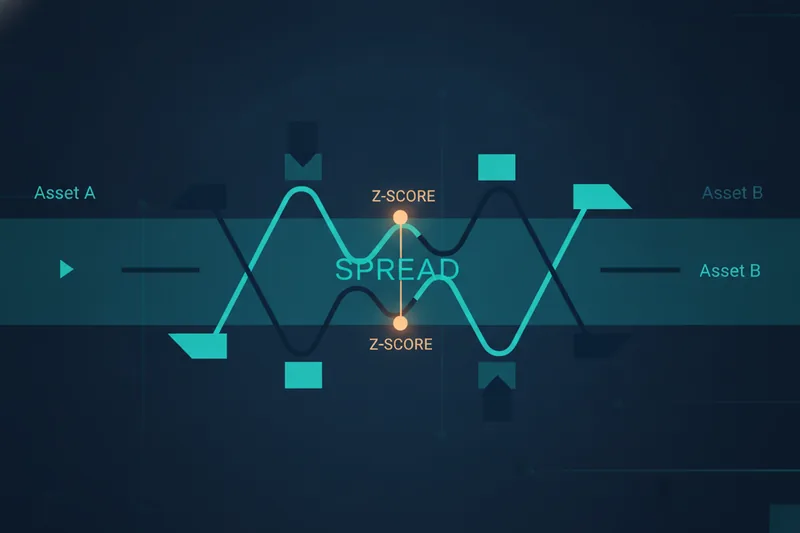
To turn "the spread looks unusually wide" into an actual trading rule, traders typically convert the spread into a z-score — a measure of how many standard deviations the current spread is from its historical average. A z-score of zero means the spread sits exactly at its average; a z-score of plus or minus two means it has moved two standard deviations away, which is where many traders consider the deviation statistically significant enough to act on.
A common rule of thumb: enter the trade when the z-score crosses a threshold such as +2 or -2 (go short the spread above +2, long the spread below -2), and exit when it reverts toward zero. A stop-loss is usually set at a further extreme — for example, if the z-score keeps widening past +3 — to protect against the case where the spread doesn't revert at all. None of these thresholds are universal; they depend on how volatile the spread itself is and how far back the historical average is calculated, so traders typically test several lookback windows before settling on parameters for a given pair.
A Worked Example of a Pairs Trade
Consider two established companies in the same industry whose share prices have historically tracked each other closely — call them Stock A at $100 and Stock B at $80, with a long-run spread (A minus B, adjusted for their typical ratio) that averages around $20.
Suppose news specific to Stock A pushes it up to $108 while Stock B stays flat at $80. The spread has widened to $28, well above its historical average, and the z-score calculation shows this is roughly two standard deviations beyond the norm. A pairs trader reads this not as "Stock A is a good buy" but as "the relationship between these two has stretched further than usual." The trade is to short Stock A and buy Stock B in matched dollar amounts.
Over the following weeks, if the news-driven move fades and no new information emerges to justify a permanently different relationship between the two companies, the spread drifts back toward $20. The trader closes both legs: buying back the short in Stock A at a lower price than it was sold, and selling the long in Stock B at a similar or slightly higher price. The profit comes from the $8 of spread compression, not from correctly predicting that Stock A would fall or Stock B would rise in isolation — in fact, both prices could have risen or fallen together during the holding period and the trade would still have worked, because it was the relationship between them, not their direction, that resolved.
Pairs Trading vs. Correlation Trading and Directional Bets
It's worth being precise about what pairs trading is not, because the term gets stretched to cover strategies that don't share its core property.
Directional trading — buying a stock because you expect it to rise, or shorting it because you expect it to fall — carries full exposure to the overall market. If the market drops sharply, a directional long position loses money regardless of how right the underlying thesis was. Pairs trading is explicitly built to avoid this: by holding offsetting long and short legs, the strategy is designed to be indifferent to whether the broader market moves up or down.
Correlation trading, as distinct from pairs trading proper, often means taking a view that two assets will continue moving together or that their correlation itself will change, without necessarily structuring a spread trade around a verified long-term equilibrium. This can look similar to pairs trading on the surface — two related assets, a long-short structure — but without the cointegration foundation, it's closer to a bet on a statistical relationship persisting than a trade on a known tendency to revert. The distinction matters because a correlation-only pair can drift apart with no mechanism pulling it back, turning what looked like a market-neutral position into an unhedged directional loss on both legs at once.
Where Pairs Trading Breaks Down: Risks and Limits
The biggest risk in pairs trading is a regime shift: a structural change that breaks the historical relationship between the two assets rather than a temporary divergence that will revert. A merger, a regulatory change affecting one company and not the other, a shift in one asset's underlying business model, or a sector-wide disruption can all permanently widen a spread that previously reverted reliably. When this happens, the statistical arbitrage logic the trade depends on — profiting from a predictable, repeating divergence — simply stops applying, and holding the position longer doesn't bring the spread back; it just compounds the loss.
Execution and liquidity risk compound this problem. A pairs trade requires getting into and out of two positions at roughly the same time and in a stable ratio; if one leg is thinly traded, the price you actually get on entry or exit can differ meaningfully from the spread level that triggered the signal, eating into or erasing the expected profit. This is especially relevant for pairs involving smaller-cap stocks or less liquid futures contracts, where the cost of moving in and out of a position can be larger relative to the spread the trade is trying to capture.
None of this makes pairs trading unworkable — it makes it a strategy whose edge depends on continuously verifying that the underlying relationship still holds, rather than one that can be set up once and trusted indefinitely. Traders who treat pair selection and risk limits as an ongoing process, not a one-time setup, are the ones who tend to survive the inevitable periods when a spread simply doesn't come back.