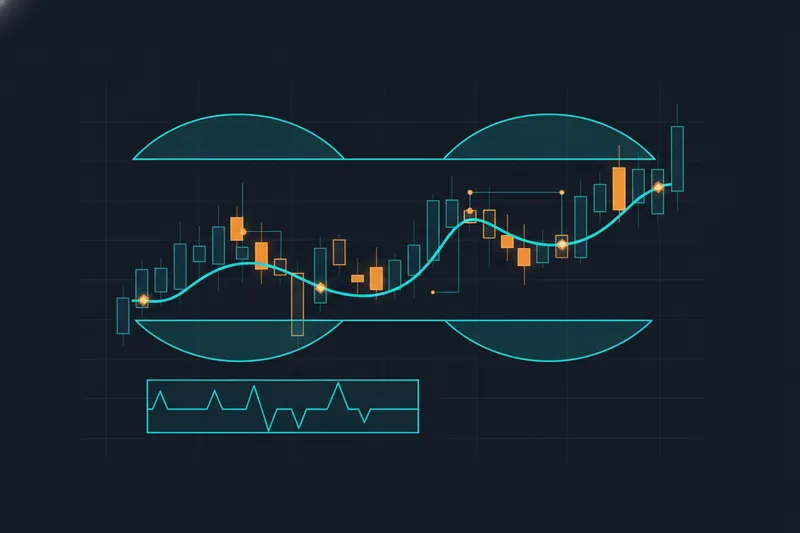
Trading Indicators Explained: Types & Signals
Trading indicators are mathematical summaries of price, volume, or momentum data — moving averages, oscillators, and volatility bands are all built from the same underlying OHLCV series (open, high, low, close, and volume for each period), just processed differently. Reading an indicator's value on a chart only answers half the question: whether it's high, low, rising, or falling. To actually trade on it, that reading has to be rewritten as an explicit rule — a condition such as "RSI below 30" — that a backtest or an automated strategy can evaluate consistently, trade after trade.
What Is a Trading Indicator?
A trading indicator is a formula applied to historical or live market data that compresses raw price, volume, and momentum information into a single, more interpretable value or line. Instead of eyeballing a candlestick chart, a trader looks at a number or a line derived from it: a 20-period average, a ratio of recent gains to recent losses, a band drawn around a moving price. Every indicator takes one or more of three inputs — price, volume, or the rate of change in price (momentum) — and recalculates as new data arrives. On its own, an indicator describes a market condition. It doesn't yet tell a trader or a bot what to do about it.
The Main Types of Trading Indicators
Indicators are usually grouped by what aspect of the market they summarize.
Trend
Trend indicators smooth out price to show direction and strength over time. Moving averages and MACD fall here — they're built to answer "is the market generally moving up, down, or sideways," not to catch every short-term wiggle.
Momentum
Momentum indicators measure the speed and size of recent price moves rather than direction alone. RSI and the stochastic oscillator belong to this group, flagging when a move looks stretched or exhausted.
Volume
Volume indicators track how much is being traded, not just at what price. A price move on rising volume reads differently than the same move on thin volume — volume indicators make that participation visible.
Volatility
Volatility indicators measure how much price is swinging, independent of direction. Bollinger Bands are the common example, widening and narrowing as price action gets more or less erratic.
How Common Indicators Are Calculated and Read
A simple moving average (SMA) is the average closing price over a fixed number of periods — a 20-period SMA on daily candles is just the last 20 closes added up and divided by 20. An exponential moving average (EMA) does the same job but weights recent prices more heavily, so it reacts faster to new data than an SMA with the same period count.
MACD (moving average convergence divergence) subtracts a longer EMA from a shorter one, producing a line that oscillates around zero and is itself smoothed into a signal line. RSI (relative strength index) compares the size of recent gains to recent losses and expresses the result as a value between 0 and 100 — readings are typically read as overbought above 70 and oversold below 30.
Bollinger Bands plot a moving average with two bands above and below it, spaced by a multiple of recent price volatility; the bands widen when volatility rises and contract when it falls. A related volatility measure, the true range, takes the largest of three figures — current high minus current low, high minus the previous close, or low minus the previous close — with the subtraction done as an absolute value so the result is never negative. The stochastic oscillator compares a closing price to its recent high-low range, again scaled from 0 to 100.
Pivot points are fixed price levels calculated from the prior period's high, low, and close, used to mark where price might stall or reverse. Support and resistance are the price zones where buying or selling pressure has previously reversed a move — not calculated from a formula like the others, but identified from where price has reacted before.
From a Raw Reading to a Buy or Sell Signal
A reading only becomes a signal once it's attached to a threshold or an event. There are two common patterns.
A threshold-based signal fires when an indicator crosses a fixed level. "RSI below 30" is a threshold condition: it's true the moment RSI drops under 30 and false otherwise. The trader (or the strategy) decides in advance what action that triggers — typically looking for a long entry, on the assumption that the asset is oversold.
A crossover-based signal fires when two values change position relative to each other. The classic case is the MACD line crossing above its signal line, which is read as a shift toward upward momentum; crossing below reads the opposite way. Moving average crossovers work the same way — a shorter-period average crossing above a longer one is treated as a trend-change signal.
In both cases, the indicator itself hasn't changed. What's changed is that a continuous value has been turned into a discrete, testable event: true or false, on a specific candle, that a backtest can count and a bot can act on. That translation — reading to condition — is the step most explanations of indicators skip, and it's the one that actually makes an indicator usable in a strategy.
Combining Indicator Conditions Into a Coherent Rule Set
A single condition is rarely enough on its own — RSI below 30 fires in strong downtrends too, not just at reversals, which is why it so often gets paired with something else. Combining conditions with logical operators is how a strategy filters out some of that noise.
An AND relationship requires every condition to be true at once. A common pattern pairs a trend filter with a momentum trigger: price above its 200-period moving average (confirming an uptrend) AND RSI below 30 (confirming a pullback within that trend). Neither condition alone says much; together, they describe a specific situation — a dip inside an established uptrend — that's more defined than either reading in isolation.
An OR relationship fires if any one condition is true, which widens how often a rule set triggers rather than narrowing it. A strategy might take a short entry on MACD crossing below its signal line OR price breaking below a recent support level — two different ways of reaching the same conclusion.
Real rule sets usually nest both: an AND block establishing the market context (trend direction, volatility regime) gated around an OR block of possible triggers within it. The logic stays simple piece by piece; it's the combination that captures something closer to how a discretionary trader actually reasons through a setup.
Indicators, Conditions, and Strategies: Telling Them Apart
These three terms get used loosely, but they describe different things. An indicator is a calculated value — RSI, MACD, a moving average — with no action attached. A condition is that value tested against a threshold or another value, producing a true/false result on each candle. A strategy is a full set of conditions covering entries, exits, position sizing, and risk controls, applied consistently over time.
A condition answers "should I act right now." A strategy answers "how do I trade this market," and it only earns that label once it's been checked beyond a single rule firing correctly. That typically means both backtesting it against historical data and forward testing it on live or simulated data before committing real capital — neither step substitutes for the other.
Where Indicators and Rule-Based Logic Stop Being Reliable
Indicators are calculated from past and current prices, so every one of them lags the market to some degree — a moving average confirms a trend after it's already underway, not before. Faster-reacting versions like EMAs reduce that lag somewhat but trade it for more false signals in choppy conditions.
False signals are conditions that trigger without the expected follow-through — RSI dips below 30 and price keeps falling instead of reversing. No combination of indicators eliminates these; combining conditions reduces how often they fire, not whether they can still happen.
Stacking more and more conditions to filter out false signals carries its own risk: overfitting, where a rule set is tuned so closely to past data that it stops describing anything repeatable. A common pattern is traders adding a fourth or fifth filter until a backtest looks clean, only to find the same rules under-trade or misfire once markets shift — a sign the rules were fit to history rather than to a genuine edge.
Common Questions About Indicator-Based Trading
What counts as a "trading indicators list"?
Most lists group indicators by categories such as trend, momentum, volume, and volatility above, and name a handful of commonly used examples in each, such as moving averages, RSI, MACD, volume, and Bollinger Bands — though some classifications use different or additional categories. The category matters more than the specific name, since indicators in the same group tend to behave similarly.
Can one indicator alone be a strategy?
A single indicator can generate a condition, but a condition on its own isn't a strategy — it has no exit rule, no position sizing, and no risk control attached. Most traders pair at least one trend or context filter with a trigger condition before testing it as a standalone approach.