What Is VWAP in Trading? Definition & How to Use It
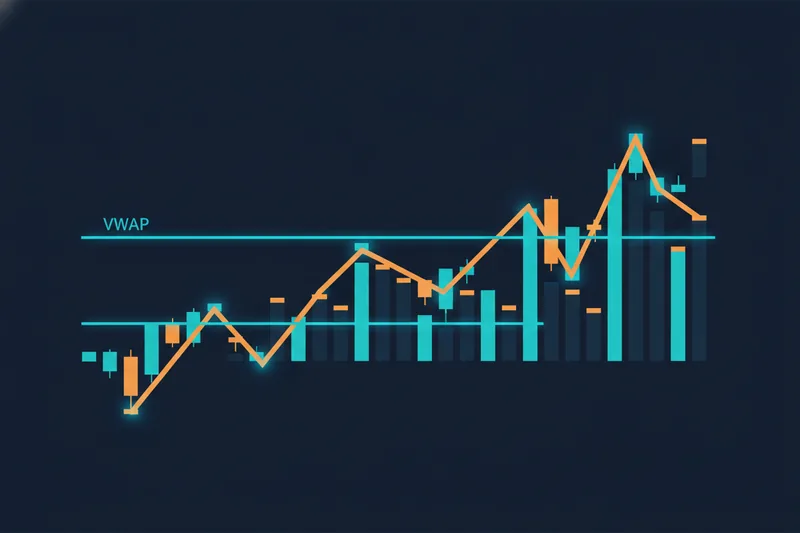
VWAP, or volume-weighted average price, is a running average of price that weights every print by the volume traded at it, giving traders a single line that represents where the bulk of a session's dollar volume has actually changed hands. It's not a moving average over a fixed number of candles — it's closer to a real-time estimate of the session's fair value, recalculated with every trade. Traders read price against it to judge whether the current level is cheap or expensive relative to where the market has actually been transacting that day, and to spot moments when that relationship shifts.
What VWAP Actually Measures
VWAP measures the average price of an asset for the current session, weighted by how much volume traded at each price. A simple average of the day's high and low tells you the range; VWAP tells you where most of the activity actually occurred within that range. If a stock spikes to a new high on thin volume and spends the rest of the day trading well below it, a simple moving average won't distinguish that spike from genuine conviction — VWAP will, because the spike contributes little weight if few shares traded there.
This is why VWAP functions as a fair value benchmark rather than a trend line. Institutional desks originally used it to measure whether their own execution was better or worse than the market's average price for the day — filling below VWAP on a buy order meant a good fill. Retail traders have adopted the same line for a related but distinct purpose: gauging whether current price is trading at a premium or discount to the session's volume-weighted center of gravity.
Because it's a session-based running average, VWAP only exists intraday. It starts fresh at the open and accumulates through the close, which also means it has no meaning before the first trade of the day and stops updating once the session ends. That reset behavior is central to how it's calculated and why it differs from indicators built on a fixed number of past bars.
How VWAP Is Calculated
The formula broken down
VWAP is the cumulative sum of price multiplied by volume, divided by the cumulative volume, recalculated after every new trade or bar:
VWAP = Σ(typical price × volume) / Σ(volume)
The typical price for each interval is usually the average of that bar's high, low, and close. Multiplying it by the volume traded during that bar weights the contribution of each price point by how much activity happened there. Summing those products across every bar since the session open, and dividing by total volume traded over the same stretch, produces a single average that shifts more when volume is heavy and barely moves when volume is thin.
Because the formula is cumulative rather than based on a fixed lookback window, VWAP isn't comparable to a 20-period or 50-period moving average in mechanism — it has no period at all. Every new bar simply adds to both the numerator and denominator, so early in the session VWAP can swing noticeably on a single large trade, while later in the day it becomes harder to move because it's averaging over a much larger base of accumulated volume.
Why it resets each session
VWAP resets at the start of each new trading session because its purpose is to describe that session's volume-weighted fair value, not a rolling average that blends today's trading with yesterday's. A cumulative average that never reset would keep diluting new information with old, and would lose the property that makes VWAP useful: a clean read on where this session's volume has concentrated. The reset is also why comparing yesterday's closing VWAP level to today's opening price doesn't tell you much — they're answers to the same question asked on two different days, not points on a continuous line.
Reading Price Against VWAP: A Worked Example
A single-session walkthrough
Take a hypothetical stock opening at 50.00. In the first 30 minutes it trades heavily between 49.80 and 50.20 on above-average volume, then drifts up to 50.60 on lighter volume through midday, before a late-session push on renewed volume carries it to 51.00 into the close.
Early in the session, VWAP sits close to 50.00 because that's where most of the volume traded. As price drifts to 50.60 on thin participation, VWAP lags behind, maybe reaching only 50.15, because that heavier early volume still dominates the cumulative calculation. Price is now trading above VWAP — a trader reading this would note the stock is at a premium to the session's volume-weighted average, which many use as a loose bias toward strength, though it says nothing by itself about whether that premium will hold.
If price had instead dipped below VWAP during the midday lull and then pushed back above it on the late push, that move back across the line is what's called a VWAP reclaim — price that had been trading at a discount regains the average, often read as a shift back toward buyers being in control. A reclaim is a description of where price crossed, not a guarantee the move continues.
Some platforms also plot VWAP bands — lines offset from VWAP by a standard deviation of price, similar in spirit to Bollinger Bands but centered on the volume-weighted average instead of a simple moving average. Price pushing into the upper band suggests it's trading further from fair value than is typical for that session; whether that means overextended or simply trending hard depends on context the bands alone don't supply.
VWAP vs Moving Averages and Other Volume-Weighted Tools
A simple or exponential moving average is time-based: it averages closing prices (or another price point) over a fixed number of bars, regardless of how much volume traded during any of them. VWAP is volume-based and session-anchored: it has no fixed period, resets daily, and weights every price by the size of the trades that occurred there. Two stocks with identical closing prices over the last 20 bars will have identical 20-period simple moving averages however lumpy their volume was, but their VWAPs can differ sharply, since VWAP is explicitly built to reflect where volume concentrated rather than just where price closed.
This distinction matters most in the first part of the session. A 50-period moving average on a 5-minute chart is still partly built from the previous day's bars early in the morning; VWAP has already discarded all of that and started clean at the open. That makes VWAP more responsive to the current session's character, at the cost of being undefined or unstable in the first few minutes of trading when cumulative volume is still small.
Anchored VWAP extends the same calculation but starts the cumulative sum from a point the trader chooses, rather than the session open — a swing high, a swing low, an earnings release, or the start of a multi-day trend. The math is identical; only the starting point changes. This lets traders measure fair value relative to a specific event rather than an arbitrary calendar boundary, which is one way traders adapt VWAP's single-session limitation to longer analysis.
VWAP belongs to a broader family of volume-weighted tools that includes volume profile, which shows the distribution of volume across price levels rather than a single running average line. Where VWAP gives one number that moves through time, volume profile gives a full picture of where volume built up across a range. The two are often read together: VWAP for the dynamic, session-moving benchmark, and volume profile for the static structure beneath it.
Common VWAP Misreadings
The most common mistake is treating VWAP as a standalone trading signal — buying because price is above it, selling because it's below. VWAP describes a relationship between current price and the session's volume-weighted average; it doesn't encode anything about momentum, support, or where volume might show up next. Traders who build systematic rules around VWAP almost always pair it with other conditions rather than acting on the line alone.
A second misreading is ignoring low-volume distortion. In the opening minutes of a session, or during a thin holiday-shortened day, a handful of large trades can swing VWAP sharply because the cumulative volume base is still small. A VWAP reading taken 90 seconds after the open carries far less weight than the same reading two hours later, even though the line looks identical on the chart.
The third is treating a reclaim as confirmation that a move will continue. A reclaim tells you price has crossed back over the volume-weighted average — it's a description of the crossing, not evidence of sustained buying or selling pressure afterward. Price frequently reclaims VWAP and then chops back below it within minutes, especially in low-conviction markets.
Where VWAP Stops Being Useful
VWAP loses reliability during low-volume periods — pre-market, after-hours, or on illiquid tickers — because the calculation depends on enough volume accumulating for the average to mean anything. A VWAP built from a handful of trades isn't representing broad market consensus; it's representing whoever happened to transact.
It also has real multi-day limitations. Standard VWAP only covers the current session, so it can't describe a multi-day trend on its own — that's what anchored VWAP is for, starting the calculation from a chosen point rather than the daily open. Without anchoring, comparing VWAP levels across different days is comparing answers to different questions.
Finally, VWAP's usefulness is entirely dependent on its reset. Once a new session begins, the previous day's VWAP is history — it doesn't inform the new calculation, and treating it as a carryover support or resistance level conflates two separate measurements. VWAP is a tool for reading the current session's volume-weighted fair value, not a persistent structural level, and it's most useful when read that way rather than stretched into roles it wasn't built for.