How Does the Stock Market Work | Quberas

The stock market works through a simple loop: buyers and sellers submit orders to trade shares of public companies, an exchange matches those orders electronically, and the price at which trades actually clear becomes the stock's current price. Every price you see on a ticker is the last agreed-upon deal between a buyer and a seller — nothing more mystical than that. This guide walks through each part of that loop — exchanges, orders, price discovery, cycles, and returns — so you build a real mental model instead of memorizing scattered terms. Most beginners get the vocabulary before they get the mechanism, which is exactly why phrases like "market maker" or "bull market" float around without sticking. Closing that gap is also the starting point for anyone who eventually wants to stop guessing when a setup is "good" and start testing it — which is the problem no-code tools like Quberas exist to solve, once you're ready to turn what you observe on a chart into rules you can actually check.
What Is the Stock Market?
The stock market is the collective system of exchanges and marketplaces where shares of publicly traded companies are bought and sold. A share (or stock) represents a unit of ownership in a company — owning one gives you a proportional claim on its future profits and assets, however small.
Companies don't sell shares directly on a street corner. They list them on a stock exchange, a regulated venue that provides the infrastructure and rules for trading. The two largest in the U.S. are the NYSE (New York Stock Exchange), which still uses a hybrid of electronic and floor-based trading, and the NASDAQ, which is fully electronic and historically home to more technology companies. A company that has sold shares to the public and listed on one of these exchanges is called a publicly traded company — its ownership is now split among thousands or millions of shareholders instead of a small private group.
How Does the Stock Market Work? (Step-by-Step)
Once a company is listed, its shares trade continuously during market hours. Here's the mechanical path a single trade takes.
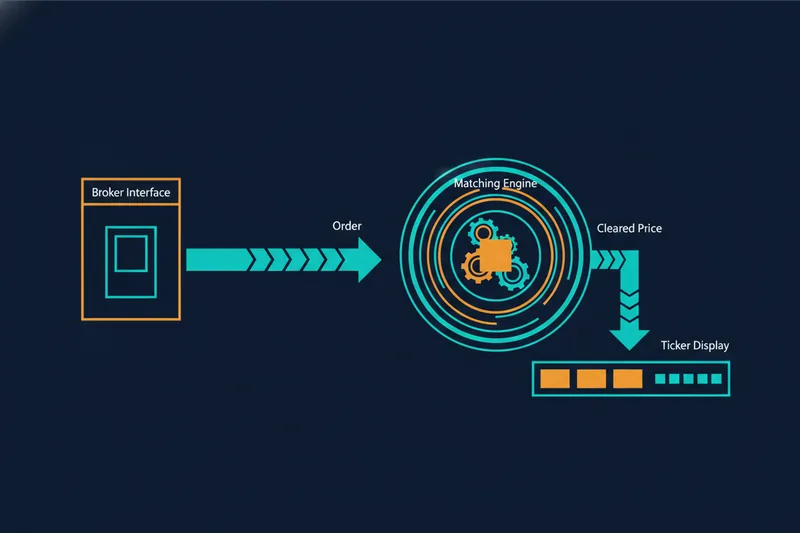
Placing an order through a broker
You can't call an exchange directly. You place an order through a broker — a licensed firm that has access to the exchange's systems — using a brokerage account, which holds your cash and the shares you own. When you enter an order to buy or sell, your broker routes it to an exchange or trading venue for execution.
How buy and sell orders get matched
Every order specifies a quantity and, usually, a price condition. The exchange's matching engine pairs a buyer's order with a seller's order at a price both sides agree to. Market makers — firms obligated to continuously quote both a buying and a selling price — add liquidity so trades can happen even when a natural buyer or seller isn't immediately available. The most common order types are a market order (execute immediately at the best available price), a limit order (execute only at a specified price or better), and a stop-loss order. A trade only occurs, and a new price only prints, when a buy order and a sell order actually match.
Primary Market vs Secondary Market
Shares first come into existence in the primary market: a company sells new shares directly to investors, most commonly through an IPO (initial public offering), in exchange for capital it can use to grow the business. From that point on, when you buy or sell shares on an exchange, you're not trading with the company — you're trading with another investor. That's the secondary market, and it's where nearly all day-to-day stock market activity — the buying and selling that determines the price you see quoted — actually happens.
How Stock Prices Are Determined
Prices move through price discovery: the continuous process by which the interaction of buy and sell orders reveals what a share is currently worth to the market. This is supply and demand in real time. More buyers willing to pay up than sellers willing to accept the current price pushes the price higher; the reverse pushes it lower.
At any moment, the best price a buyer is offering is the bid, and the best price a seller will accept is the ask. The gap between them is the bid/ask spread, and it narrows or widens based on how much trading interest — and how many market makers — are active in that stock. A heavily traded stock like a large S&P 500 constituent typically has a razor-thin spread; a thinly traded small-cap can have a much wider one, meaning you may pay noticeably more to buy than you'd receive to sell at the same instant.
Market Indices and Market Cycles: Bull vs Bear
You can't track every one of the thousands of listed stocks individually, so the market uses market indices to summarize overall movement. The S&P 500 tracks 500 large U.S. companies weighted by market value; the Dow Jones Industrial Average tracks 30 large industrial-era companies using a price-weighted formula. When people say "the market was up today," they're usually referring to one of these.
Zoomed out over months or years, the market moves through broad phases. A bull market is a sustained period of rising prices and investor optimism; a bear market is a sustained period of falling prices, typically defined as a drop of 20% or more from a recent high, often accompanied by pessimism about the economy. Neither state is permanent — the market has historically cycled between the two repeatedly.
How Investors Make Money: Dividends and Capital Gains
Owning shares generates returns in two distinct ways. Dividends are a portion of company profits paid out directly to shareholders, usually quarterly — not all companies pay them; many growth-focused companies reinvest profits instead. Capital gains are the profit from selling a share for more than you paid for it. A stock's total return combines both: the dividends collected while holding it plus (or minus) whatever it gained or lost in price by the time you sell.
Reading the Market Visually: From Price Charts to Trading Rules
Everything above explains why a price moves. Price action — the pattern a stock's price traces over time on a chart — is how that "why" becomes visible. A rising sequence of higher lows might reflect steady buying demand; a sharp drop on high volume might reflect a shift in sentiment. Reading price action is really just watching supply and demand play out in chart form.
Once you can read a chart, the natural next step is turning what you see into explicit conditions — "if price crosses above this level while volume rises, that's a signal" — instead of relying on a gut feeling every time. That's the same shift that separates discretionary trading from algorithmic trading: instead of deciding in the moment, you define the rule once and let it apply consistently. This is also where backtesting — running a rule against historical price data to see how it would have performed — becomes essential, since a rule that looks obvious in hindsight often behaves differently once tested. Automated trading tools for this purpose range from full coding environments for building custom logic to no-code, visual builders that let you define the same conditions without programming — the underlying goal in either case is making your trading logic explicit enough to check, rather than leaving it as an instinct you can't verify.
How to Start Investing in the Stock Market
Getting started is procedural, not mysterious:
- Open a brokerage account with a regulated broker and fund it.
- Decide your approach — buying individual stocks, index funds tracking something like the S&P 500, or a mix.
- Place your first order, understanding the difference between a market order (speed) and a limit order (price control).
- Track your positions and understand what you're paying to trade. Many brokers advertise commission-free trading, but sell orders can still carry small passthrough regulatory fees regardless of the broker's commission structure — worth checking before you assume a trade is entirely free.
- Set a plan for how long you intend to hold and under what conditions you'd sell.
Risks and Rewards of Stock Market Investing
Stock prices are volatile: they can move sharply in either direction over short periods based on earnings, economic data, or broad sentiment shifts. That volatility is also the source of potential reward — without price movement, there are no capital gains to earn. The core trade-off is risk versus reward: assets with higher long-term return potential generally come with larger short-term swings.
This is also where time horizon matters. Long-term investing — holding through cycles and letting dividends and gains compound — spreads out the impact of any single bad stretch. Active trading — entering and exiting more frequently to capture shorter moves — demands a much clearer, testable process, because you're relying on your own judgment far more often and with less time for mistakes to average out.
Stock Market for Beginners: Key Terms
- Stock exchange (NYSE, NASDAQ): the regulated venue where shares are listed and traded.
- IPO (initial public offering): the first sale of a company's shares to the public.
- Dividends and capital gains: income from company payouts and profit from selling shares at a higher price.
- Bull vs bear market: sustained periods of rising prices versus sustained periods of falling prices.
- Market makers/order types: firms that quote continuous buy/sell prices; market and limit orders are the two basic ways to execute a trade.
FAQs
How does the stock market work for beginners? At its core: you open a brokerage account, place an order to buy shares of a public company, and that order is matched against another investor's order on an exchange at an agreed price. Everything else — indices, cycles, dividends — builds on that basic mechanism.
How do you make money in the stock market? Two ways: collecting dividends paid out by companies you own, and capital gains from selling shares for more than you paid. Most long-term returns come from a combination of both.
What is the stock market, in one sentence? It's the network of exchanges where ownership stakes in public companies are bought and sold, with prices set continuously by supply and demand.
Once you can follow a stock's price action and articulate why a level matters — not just react to it — you're ready to stop treating trading decisions as gut calls. Quberas lets you take those observations and build them into a visual, testable set of trading rules, backtest them against real history, and see exactly where each condition would have triggered on the chart, without writing a line of code.