Time the Market Without Guesswork | Quberas
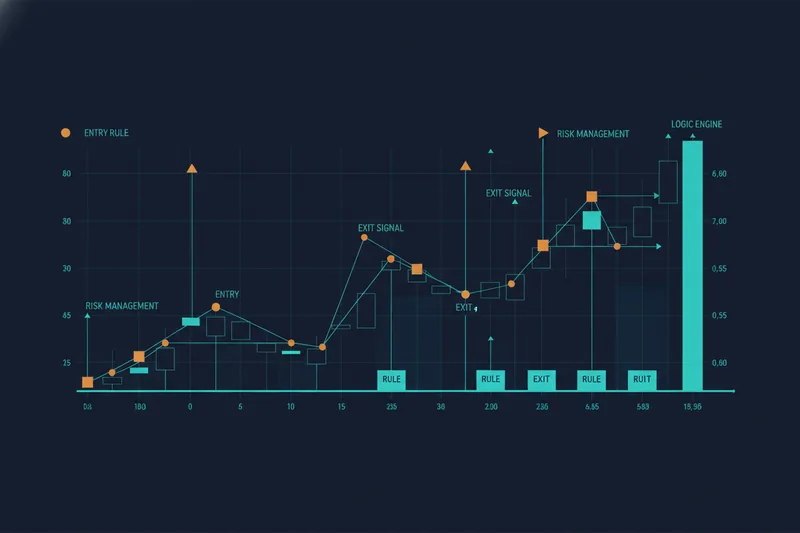
If you searched “time market” expecting grocery store locations, you're in the wrong aisle — this is about market timing: deciding when to enter or exit a trade based on a defined set of rules rather than a hunch. Done well, market timing turns "I think this looks good" into "these three conditions were true, so the position opened." This article walks through the logic behind timing rules, the main approaches traders use, how to test them against history before risking money, and how to build the whole thing visually without writing code.
What Does It Mean to "Time the Market"?
Market timing is the practice of making entry and exit decisions based on observable conditions — price levels, indicator readings, volume shifts — instead of reacting in the moment. An entry decision answers "is this the right point to open a position?" An exit decision answers "is this the right point to close it, for profit or to cut a loss?" Both should ideally be answerable the same way every time a similar setup appears.
Manual trading struggles here because the same trader can interpret an identical chart pattern two different ways depending on mood, fatigue, or how the last trade went. Rule-based timing removes that variability: if a condition is defined precisely (price crosses above a moving average, volume exceeds its 20-period average, an oscillator exits oversold territory), it either happened or it didn't. Gut-feel timing tends to fail for three predictable reasons: it reacts to price after the move is already visible, it lacks a consistent exit plan, and it can't be tested — you can't backtest a feeling. This is precisely the gap a platform like Quberas is built to close: it lets a trader express timing logic as visual, connected conditions on the chart, so the rule exists independently of how they're feeling that day.
The Logic Behind Market Timing Rules
Before any tool enters the picture, timing rules are built from three raw ingredients: price action (where the market is trading now relative to recent history), indicators (mathematical transformations of price and volume, like moving averages or RSI, that surface a trend or momentum signal), and volume (how much is being traded, which confirms or undermines a price move). A rule is really a condition — a specific, testable statement — and a trigger is the moment that condition becomes true.
How indicator crossovers signal a timing opportunity
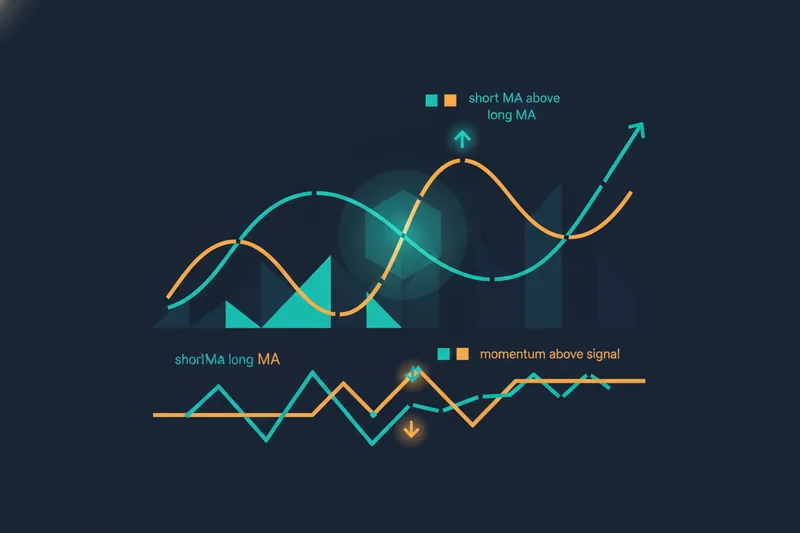
A crossover occurs when one line crosses another — a short moving average crossing above a longer one, or a momentum oscillator crossing above its signal line. Crossovers are popular timing signals because they mark a measurable shift in direction rather than a subjective read of "the trend looks like it's turning." On their own, though, a single crossover is a weak signal — it can fire on noise as easily as on a genuine shift.
Combining multiple conditions with nested logic
This is why serious timing rules rarely rely on one condition. A trader might require a moving-average crossover and volume above its average and price above a key level — all true at once — before treating it as a valid entry. Nesting conditions like this ("if A and B, then check C") filters out weaker signals, but it introduces a new risk: overfitting, where a rule is tuned so tightly to past data that it stops working on new data because it was really just memorizing history rather than capturing a repeatable pattern. The fix is to keep the logic explainable — you should be able to say why each condition is there — rather than adding filters until backtest results look perfect.
Common Market Timing Approaches
Most timing rules fall into a handful of recognizable families rather than infinite variety. Trend-following timing waits for confirmation that a directional move is underway (a crossover, a breakout above resistance) and enters in that direction. Mean-reversion timing does the opposite: it looks for price to have moved too far from an average or level and bets on a snap-back. Day trading in general spans a wider set of related styles too — range trading, gap trading, and breakout trading are all variations on these two core ideas, and some traders compress the timeframe further into scalping, working on charts as short as one to fifteen minutes where execution speed matters as much as the signal itself.
Beyond single-entry logic, many strategies use multi-stage entries, often called averaging orders — adding to a position at predefined price levels rather than committing everything at once. This is distinct from a straightforward dollar-cost-averaging bot, which buys or sells at fixed time intervals regardless of price; averaging orders instead trigger based on price moving to specific levels, which keeps the logic tied to market conditions rather than the calendar. Every approach also needs a matching exit condition — a rule for taking profit — and a stop-loss, a hard rule for closing the position if it moves against you past a defined point. Without a stop-loss, a timing strategy has an entry logic but no risk boundary.
Backtesting a Market Timing Strategy Before Going Live
Once a timing rule is defined, it needs to be checked against history before it touches real capital. Backtesting runs the rule against past market data to see how often it would have triggered and what the outcome would have been each time. The data quality matters: basic OHLCV data (open, high, low, close, volume per period) is enough for many trend or crossover rules, but strategies sensitive to execution — where the fill price matters as much as the signal — benefit from bid/ask and order-book-derived data, which reflect the actual buy and sell interest at each price level rather than just the candle's summary.
Backtesting alone isn't the finish line, either — validating a rule properly means treating backtesting and forward testing (running the rule live on paper or with minimal size before committing real capital) as two required stages, not one optional extra after the other. Comparing variations of the same rule side by side — a tighter stop-loss versus a wider one, a 20-period average versus a 50-period one — is how a trader learns which specific parameters actually hold up, rather than assuming the first version they built is the best one.
Debugging and Tuning Timing Signals to Reduce False Triggers
Even a backtested rule generates false signals — cases where a condition almost triggered but didn't, or triggered on noise rather than a genuine setup. Reducing these requires seeing not just when a rule fired, but how close it came to firing when it didn't. Quberas' visual debugger highlights the exact chart zones tied to each condition, so a trader can see directly on the chart where price nearly crossed a threshold versus where it clearly did. Inspecting "almost" versus "triggered" cases is how you tell the difference between a threshold that's too loose (catching noise) and one that's too tight (missing real setups). From there, threshold tuning — nudging a moving-average length, a volume multiple, or a percentage band — is a targeted adjustment based on evidence from the chart, not a guess.
Building Your Market Timing Strategy Visually with Quberas
Everything above — conditions, crossovers, multi-stage entries, exits, stop-losses, backtesting, tuning — comes together in Quberas' deal map: a drag-and-drop layout where each stage of a strategy (entry, averaging orders, exit, stop-loss) is a connected block you can see and rearrange. Conditions themselves are built with a puzzle-style condition builder, letting you nest price, indicator, volume, and crossover logic into an "if this and this, then that" structure without writing a formula or a line of code. Risk controls sit at the scenario level, so limits apply to the strategy as a whole rather than being buried inside code you'd have to re-read to trust.
Using a ready-made strategy instead of building from scratch
Not every trader wants to start from a blank canvas. The strategy marketplace lets you select an existing timing strategy, review and adjust its risk parameters, backtest it against your own assumptions, and launch it — useful for validating the framework in this article before committing to building custom logic.
Publishing and monetizing your own timing strategy
Once a timing strategy performs the way you want, you can publish it — publicly or via a private link with a whitelist — and earn recurring payouts when others use it, with commission terms depending on your plan.
FAQ: Timing the Market with No-Code Tools
Can you consistently time the market? No system guarantees catching every top and bottom. What rule-based timing offers instead is consistency — the same conditions produce the same decision every time, which is measurable and improvable, unlike a gut call that can't be repeated identically.
What's the difference between timing and buy-and-hold? Buy-and-hold ignores short-term entry and exit decisions entirely, accepting whatever the market does over a long horizon. Market timing actively defines when to be in or out based on conditions, aiming to avoid parts of a move or cycle the rule identifies as unfavorable.
Do you need coding skills to build timing rules? Not on Quberas. The deal map and condition builder let you define entries, averaging orders, exits, and stop-losses by connecting visual blocks and conditions on the chart, rather than writing and debugging code.
Start building your own market timing strategy visually — try Quberas free and see your entry, exit, and risk rules mapped directly on the chart.