Crypto Pairs Trading: Build & Automate the Strategy
Crypto pairs trading is a market-neutral strategy that profits from the temporary divergence between two historically linked assets — not from predicting whether the market goes up or down. If you've read academic papers on the topic, you already know the theory. This guide skips the jargon and takes you through the full workflow: selecting a cointegrated pair, defining entry and exit rules around the spread, backtesting those rules, and automating the entire strategy without writing a single line of code.
What Is Crypto Pairs Trading?
First, a critical distinction: a crypto trading pair (like BTC/USDT) is simply a market denomination — it tells you what currency you're using to buy an asset. Pairs trading is something entirely different. It's a strategy where you simultaneously take a long position in one asset and a short position in a related asset, betting that the price relationship between the two will return to its historical norm.
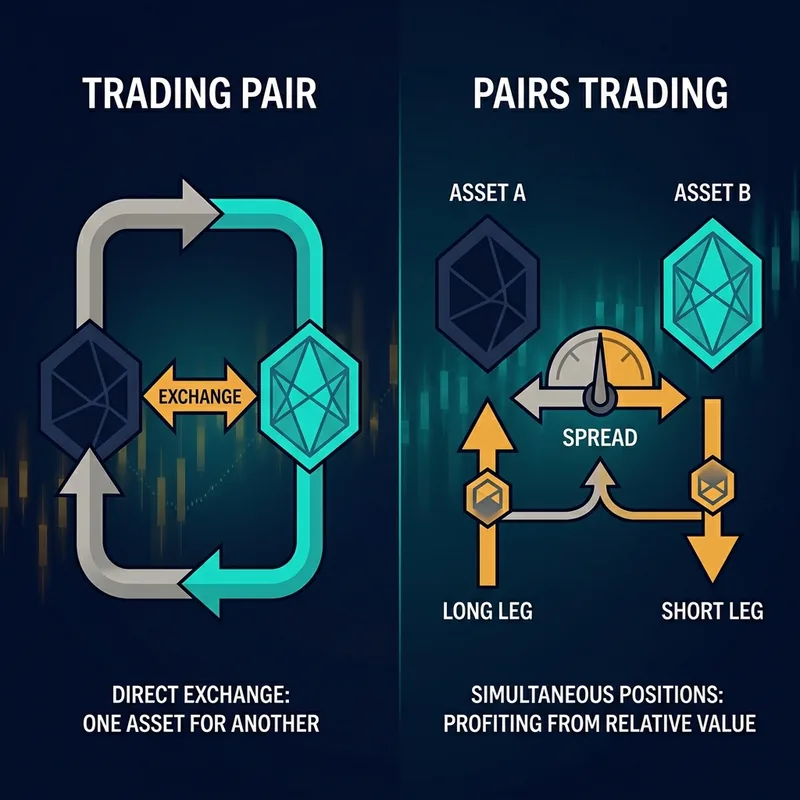
The strategy originated in equity markets, where traders observed that assets sharing similar fundamental drivers tended to move together over time. The same logic applies cleanly to crypto: assets within the same market segment — two layer-1 blockchains, two DeFi protocols — often share fundamental drivers that keep their prices anchored to each other over time.
Because you hold both a long and a short position simultaneously, your exposure to the broader market direction is largely neutralized. A market-wide crash hurts your long leg but benefits your short leg. That's what makes it a market-neutral strategy: the profit comes from the relative movement between the two assets, not from the direction of the overall market.
How Pairs Trading Works: The Core Mechanics
The Spread: What You Are Actually Trading
In pairs trading, you're not trading either asset in isolation — you're trading the spread, defined as the price difference or price ratio between the two assets. If you're trading BTC and ETH, the spread might be expressed as the ratio BTC/ETH or the dollar difference between them, normalized over a historical window.

When the spread widens beyond its historical average — meaning one asset has outperformed the other by an unusual amount — you go long the underperformer and short the outperformer. When the spread reverts to its mean, you close both legs and capture the difference.
A simple example: Suppose BTC and ETH have historically traded at a relatively stable ratio. If BTC surges sharply while ETH stays flat, the ratio deviates meaningfully from that norm. A pairs trader would short BTC and go long ETH, expecting the ratio to compress back toward its historical level. If it does, both legs close profitably regardless of whether the overall crypto market moved up or down.
Why Mean Reversion Is the Engine of the Strategy
Mean reversion is the statistical tendency of a value to return to its long-run average after deviating from it. For pairs trading, the "value" in question is the spread between two assets. The strategy only works if the spread has a stable mean to revert to — which is why pair selection is everything.
The market-neutral property holds because gains on one leg offset losses on the other during broad market moves. Your P&L is driven almost entirely by the spread compressing, not by the direction either asset takes individually.
Cointegration vs. Correlation: Why the Difference Matters
This is the most important concept in pairs trading, and the one most often misunderstood.
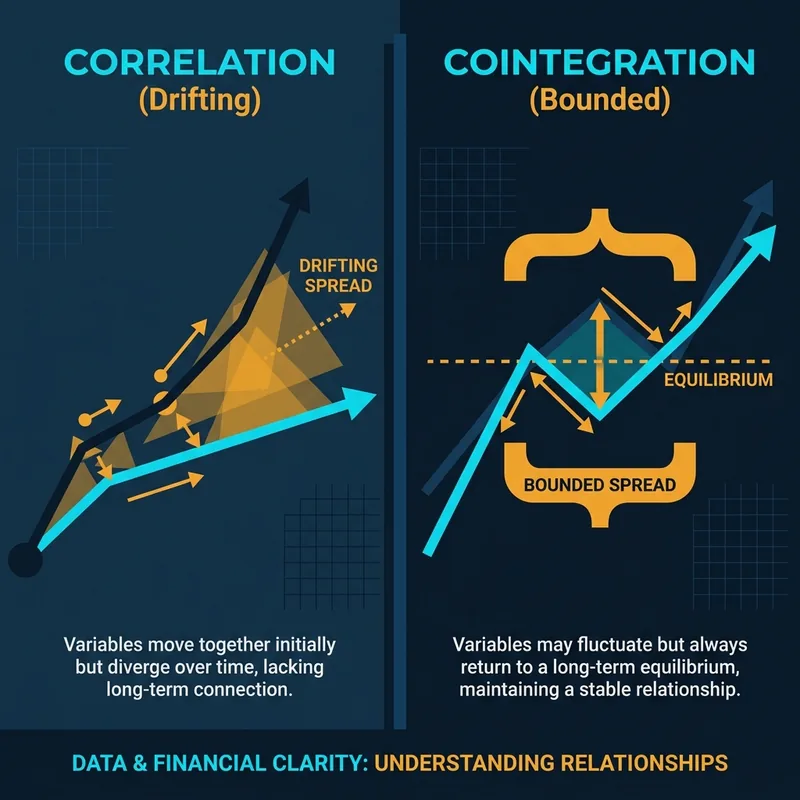
Correlation describes the degree to which two assets tend to move together over a given period. A high correlation between BTC and ETH means they generally rise and fall in tandem. That sounds like a solid foundation for pairs trading — but it isn't sufficient on its own.
Cointegration is a stricter statistical relationship. Two assets are cointegrated if their prices are linked by a long-run equilibrium — even if they diverge in the short term, there is a structural tendency for the gap between them to remain bounded rather than drift without limit. The practical implication is that the spread between cointegrated assets tends to revert toward a stable level, whereas the spread between merely correlated assets may not.
Here's why the distinction matters in practice: two assets can move closely together during a bull market and completely decouple during a regime change. If you built your pairs trade on correlation alone, you'd have no statistical reason to expect the spread to revert — it might just keep widening. Cointegrated pairs, by contrast, have a structural relationship that tends to persist across market conditions.
In crypto, commonly cited candidate pairs include large-cap layer-1 tokens — assets like BTC and ETH, or ETH alongside other smart-contract platforms that compete for the same developer and user base. These share similar fundamental demand drivers, which is what makes them worth screening for cointegration. No pair is guaranteed to remain cointegrated permanently, but same-sector assets are the right starting category.
How to Identify the Right Crypto Pairs
Quantitative Signals to Look For
Confirming cointegration statistically is the gold standard. The Engle-Granger cointegration test is one well-known approach that checks for a long-run equilibrium relationship between two price series. Other tests, such as the Johansen test, are also used depending on the tooling available. If the test rejects the null hypothesis of no cointegration, you have statistical grounds to proceed.
If you don't have access to a statistical environment, a visual check can serve as a first filter: plot the spread (price ratio or price difference) between two candidate assets over a meaningful historical window. If the spread oscillates around a relatively stable level rather than trending persistently in one direction, that's worth investigating further with a formal test.
Beyond cointegration, look for spread stability — the spread should revert within a predictable time window and shouldn't exhibit extreme spikes that would make position sizing impractical. How long that window is will vary by pair and market conditions; the key is that it's consistent enough to be tradeable.
Practical Filters: Liquidity, Sector, and Exchange Availability
Quantitative signals alone aren't enough. Apply these practical filters before committing to a pair:
- Liquidity and volume: Both assets must have sufficient daily volume to enter and exit positions without significant slippage. Thin markets on one leg create execution risk.
- Same sector or correlated fundamentals: Two layer-1 tokens, two DeFi governance tokens, two exchange tokens — pairs within the same segment share fundamental drivers, which is what underpins the cointegration. Avoid pairing assets from unrelated sectors just because they looked correlated during a single bull run.
- Exchange availability: Both assets must be tradeable on the same exchange (or exchanges you can connect to), and the short leg must be available to borrow or trade as a perpetual future.
- Regime awareness: A pair that appeared cointegrated only during one specific market phase is a red flag. Test the relationship across both bull and bear periods. Cointegration that only holds in one regime is likely correlation in disguise.
Building a Pairs Trading Strategy Step by Step
Defining Your Entry Signal
A common entry signal is the z-score of the spread — a standardized measure of how far the current spread has moved from its historical average, expressed in units of standard deviation. When the spread moves a meaningful distance above its mean, you short the outperformer and go long the underperformer; when it moves the same distance below, you reverse. The specific threshold you choose should be validated against your own backtest data rather than assumed from a generic rule.
If z-score calculation isn't available in your tooling, a percentage-deviation threshold works as a simpler alternative: enter when the spread deviates more than a defined percentage from its rolling average. The exact lookback period and deviation level should be determined through backtesting on your specific pair, not borrowed from a default setting.
Setting Exit Rules and Stop-Losses
Define two types of exit conditions before you enter any trade:
- Profit exit (spread reversion target): Close both legs when the spread returns to its mean or crosses a tighter threshold. Don't wait for a full reversion — partial reversion is still a profitable trade.
- Stop-loss: Set a maximum spread divergence beyond which you exit both legs at a loss. The right level depends on your pair's historical volatility and your risk tolerance — the key is that it's defined in advance and treated as non-negotiable. A spread that keeps widening past your stop may signal that the cointegration relationship is breaking down, not that a bigger reversion is coming.
Position Sizing Across Both Legs
Sizing both legs correctly is essential to maintaining the market-neutral character of the trade. Equal dollar amounts on each leg is a common starting point, but the more precise approach is to weight the legs using the hedge ratio derived from the cointegration regression. This reduces residual directional exposure that equal-dollar sizing can leave behind.
Regardless of the method, both legs must be managed as a single unit: entered together, sized together, and exited together. Never size the legs independently.
Pairs trading strategy rule checklist:
- Cointegration confirmed (formal test or visual spread chart as a first filter)
- Entry threshold defined (z-score or % deviation, validated in backtest)
- Profit exit target defined (spread reversion level)
- Stop-loss defined (maximum divergence, set in advance)
- Leg sizing based on hedge ratio, not arbitrary equal units
- Both legs entered and exited together
Backtesting Your Pairs Trading Strategy

Backtesting is not optional for a pairs strategy. The relationship between two assets can and does break down — and historical validation is the only way to know whether your spread thresholds were realistic and whether the cointegration held across different market conditions.
When backtesting, focus on these metrics:
- Win rate and average P&L per trade: What percentage of spread divergences reverted within your exit target, and what was the average gain?
- Average spread reversion time: How long did it typically take for the spread to revert? This determines your capital lock-up period and informs whether your thresholds are practical.
- Max drawdown per pair: What was the worst-case loss if the spread kept widening before reverting — or didn't revert at all?
- Regime sensitivity: Did the cointegration hold across both bull and bear market periods in your test window? A strategy that only works in one regime is fragile.
Watch carefully for overfitting: if you tune your entry threshold and stop-loss levels to fit a single historical window perfectly, those parameters will likely fail on new data. Test across multiple time windows and be skeptical of thresholds that only work in one specific period.
Visual backtesting — seeing exactly where your entry and exit rules triggered on the price chart — is particularly valuable for a pairs strategy. It lets you spot immediately whether your rules fired at sensible points or whether they were catching noise.
How to Automate Crypto Pairs Trading Without Code
Encoding Your Entry and Exit Rules Visually
Once your rules are defined on paper, the next step is encoding them into an automated system. For most retail traders, the traditional route — writing custom scripts in a programming language — is a significant barrier that puts systematic pairs trading out of reach.
A no-code strategy builder removes that barrier. Instead of writing code, you construct your logic visually: define the spread calculation, set the z-score or percentage-deviation threshold as an entry condition, and specify your exit and stop-loss rules using a visual condition builder that supports indicator crossovers, price comparisons, and nested logic.
In Quberas, this is done through a drag-and-drop deal map — a visual interface where you lay out entry conditions, averaging orders, exit targets, and stop-losses as connected blocks. Each condition maps directly to the rules you defined in the strategy design phase: "enter long ETH / short BTC when spread deviation crosses your entry threshold" becomes a visual block, not a line of code.

Validating the Strategy on the Chart Before Going Live
The critical advantage of a visual approach is what happens before you go live: you can see exactly where each rule triggers directly on the chart. The visual debugger highlights chart zones tied to each condition, so you can verify that your entry signals fired at the right moments, your exits closed at the correct spread levels, and your stop-losses would have protected you during the worst divergences in your backtest window.
This visual validation step catches logic errors that are invisible in a parameter table — a misaligned condition, a stop-loss set too tight, an exit rule that never triggers. Backtesting and live trading happen within the same platform, so there's no gap between the strategy you tested and the one you deploy.
Automation also removes the single biggest execution problem in mean-reversion strategies: hesitation. When the spread widens to your entry threshold, the bot opens both legs immediately. When it reverts to your exit target, both legs close. There's no second-guessing, no delayed execution on one leg, no emotional override when the spread keeps widening past your entry point.
Key Risks and How to Manage Them
Pairs trading is not a risk-free strategy. These are the failure modes that matter most:
Cointegration breakdown: The most serious risk. A regulatory change, a protocol exploit, a fundamental divergence in use cases — any of these can permanently decouple two assets that were previously cointegrated. If the spread keeps widening past your stop-loss level without reverting, treat it as a signal that the relationship may have broken, not as an opportunity to add to the position.
Liquidity mismatch: If one leg fills and the other doesn't — due to low volume or a fast-moving market — you're left with a naked directional position, which defeats the entire purpose of the strategy. Use limit orders where possible and only trade pairs with sufficient depth on both sides.
Correlation masquerading as cointegration: In volatile markets, pairs that appeared cointegrated during a calm period can decouple sharply. This is why regime testing during backtesting is essential, not optional.
Over-leveraging: Because pairs trading feels lower-risk (market-neutral), traders sometimes over-size positions. The spread can widen significantly before reverting — your position sizing must account for the maximum expected divergence, not just the typical one.
Stop-loss discipline in automation: In manual trading, it's tempting to hold a widening spread because "it always comes back." In automated execution, the stop-loss must be a hard rule. Set it before the strategy goes live and don't override it.
Ready to automate your pairs trading strategy without writing a single line of code? Build, visualize, and backtest your rules in Quberas — see exactly where your strategy triggers on the chart before you go live.