Market Indices Explained: Trading Strategies
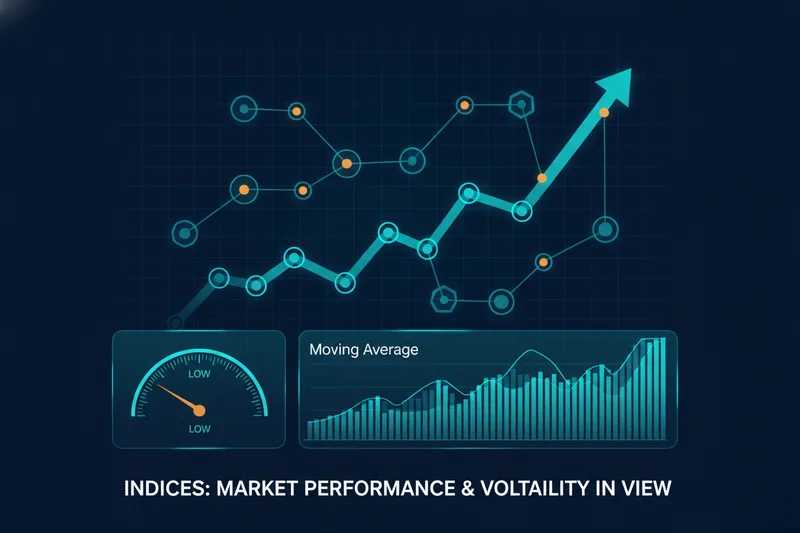
Every major index number you see scrolling across a financial news ticker is really answering one question: how is this slice of the market doing right now, compared to where it's been? A market index is a calculated composite of a chosen group of securities — stocks, bonds, or other assets — that represents the performance of a market, an industry, or a stock market sector as a single, trackable figure. Indices exist so investors and traders have a common benchmark: a reference point to judge whether an individual stock, a fund, or a whole strategy is beating or lagging the broader market. You can't buy a market index directly since it's just a number, but you can get exposure to it through an index fund/ETF, a pooled investment vehicle built to mirror the index's holdings and weightings as closely as possible.
Understanding what an index actually measures matters more than watching where it closes each day. A retail trader who only checks the headline number is missing the mechanics that make that number move — and those mechanics are exactly what you need if you want to turn "the market is up" into a rule a bot can act on. That's the gap this guide closes: once you understand how indices are built, tools like Quberas let you translate that understanding into visual, backtestable trading logic instead of just watching the tape.
How Market Indices Are Calculated: Weighting Methods
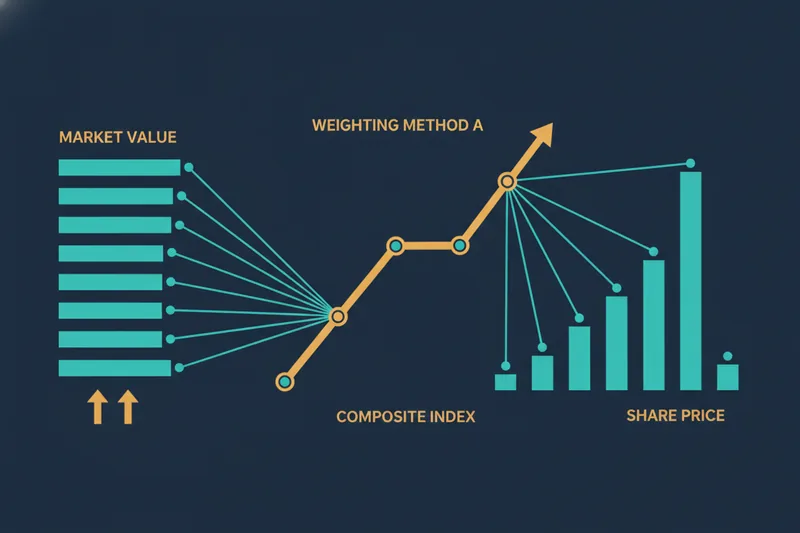
Not all indices are built the same way, and the weighting method behind an index determines which companies actually move it. Two methodologies dominate.
Market-Cap Weighted Indices
Under market capitalization weighting, each company's influence on the index is proportional to its total market value (share price multiplied by shares outstanding). A trillion-dollar company can single-handedly shift a cap-weighted index even on a day when most other constituents barely move, because index composition is skewed toward the largest names. This is why a handful of mega-cap technology stocks can drive a cap-weighted benchmark higher even when the majority of stocks in it are flat or falling.
Price-Weighted Indices
A price-weighted index instead gives more influence to whichever stocks have the highest share price, regardless of the company's overall size. A $500 stock moves the index more than a $50 stock, even if the $50 company is worth many times more in total market value. This distinction matters when you're interpreting index moves: a price-weighted index can be pulled by a single high-priced stock's earnings surprise, while a cap-weighted index reacts more to shifts among its largest constituents by total value.
Major US Market Indices
S&P 500
The S&P 500 tracks 500 of the largest US companies across sectors and is market-cap weighted, making it the most commonly cited benchmark for the overall US stock market.
Dow Jones Industrial Average
The Dow Jones Industrial Average covers just 30 large, established US companies and is price-weighted — one of the few major indices still calculated this way, which is why its point moves don't scale directly with percentage moves in the broader market.
Nasdaq Composite
The Nasdaq Composite is a cap-weighted index of essentially all companies listed on the Nasdaq exchange, heavily tilted toward technology and growth stocks, which makes it more sensitive to swings in that sector than the S&P 500.
Russell 2000
The Russell 2000 tracks 2,000 smaller US companies and is cap-weighted, serving as the standard benchmark for small-cap stock performance rather than large, established firms.
Major World Market Indices
Indices aren't a US-only concept — every major economy has its own benchmarks, and world indices let you gauge market health outside the US. Europe's broad benchmarks and country-specific indices track continental and national equity performance, Japan's leading index reflects its largest listed companies, and pan-Asian and emerging-market composites aggregate performance across multiple economies. For a trader, these international benchmarks provide global market context: divergence between US and international indices can signal where capital is rotating, and correlation (or the lack of it) between regions is itself a useful input when building diversified, rule-based strategies.
The Big 3 Indexes Compared: Dow, S&P 500, and Nasdaq
The Dow Jones Industrial Average, S&P 500, and Nasdaq Composite get quoted together constantly, but they measure different things. The Dow's price-weighting and narrow 30-stock composition make it the least representative of the broad market, despite being the oldest and most culturally familiar. The S&P 500's cap-weighting and 500-company breadth make it the closest thing to a true US market benchmark, and it's the index most professional strategies are measured against. The Nasdaq Composite, also cap-weighted but concentrated in technology and growth names, tends to swing harder in both directions — it typically outpaces the S&P 500 in bull markets driven by tech and underperforms it when growth stocks fall out of favor. Watching all three together tells you not just whether "the market" moved, but which part of it did the moving.
The VIX and the Rest of the Top 5 Indices Traders Watch
Rounding out the group traders watch alongside the big three: the Russell 2000 adds a small-cap read that often leads or lags the large-cap indices depending on the economic cycle, since smaller companies are more sensitive to credit conditions and domestic growth.
The VIX is different from everything above — it isn't a price index at all. Often called the "fear gauge," it reflects the level of volatility options traders are pricing into S&P 500 contracts, rising when markets expect bigger swings and falling when conditions look calm. If you trade VIX derivatives directly, it's worth knowing that VIX options settle against a special calculation of the VIX index itself, rather than against VIX futures prices — a detail that matters if you're building logic around VIX expirations.
How to Use Market Indices in Trading Strategies
Reading index levels is passive. Turning them into rules is where a self-directed trader actually gets an edge — and it's where a visual condition builder replaces guesswork with something you can see and test.
Turning Index Trends Into Entry Conditions
An index trend — the S&P 500 crossing above a moving average, or the Nasdaq Composite diverging from the Dow — can be defined as an entry condition in a deal map, the visual layout of a strategy's stages in Quberas, from entry through averaging orders to exit. Instead of writing code to check "is the index above its 50-period average," you connect that condition visually and see exactly where on the chart it would have triggered.
Using the VIX for Risk Management
Because the VIX measures volatility rather than price direction, it's suited to risk logic rather than entries: a rising VIX can tighten stop-losses, reduce position size, or trigger a cooldown period, while a falling VIX can loosen thresholds. Building this as a rule inside the deal map means volatility isn't just something you notice after the fact — it actively adjusts how the strategy behaves.
Backtesting Before You Trade Live
Before any index- or VIX-based rule touches real capital, backtesting runs it against historical price data to see how it would have performed. Quberas backtests using OHLCV data — the open, high, low, close, and volume figures for each period — so you can validate an index-trend or volatility-based rule across past market conditions and compare variations before going live.
Live Index Data and Common Questions
Index values you see quoted live are calculated continuously from the real-time prices of their constituent stocks. For strategy building and backtesting, that same information is captured as historical OHLCV data — the raw material both traders and platforms use to reconstruct what an index or a stock did at any point in time.
Can You Trade a Market Index Directly?
No — an index itself isn't a tradable security. To get exposure, traders use an index fund/ETF designed to replicate the index's composition and weighting, or trade derivatives based on the index.
Which Index Should You Base a Strategy On?
It depends on what you're trying to capture. The S&P 500 suits broad-market strategies, the Nasdaq Composite suits tech-sector-driven approaches, the Russell 2000 suits small-cap-focused logic, and the VIX suits volatility-based risk rules layered on top of any of the above.
Ready to turn index and volatility signals into a real strategy? Build and backtest your first no-code trading bot on Quberas — free to start.