Quantitative Trading Explained: Start Without Coding
Quantitative trading is a rules-based approach to the markets where every buy and sell decision flows from a defined, testable set of conditions — not instinct. If you've ever thought "I want to buy when the RSI crosses below 30 and sell when price hits a 2% gain," you already have the seed of a quantitative strategy. This guide explains how the full workflow operates, covers the most common strategy types, and shows how you can apply quant principles today using a visual no-code strategy builder — no Python, no math degree required.
What Is Quantitative Trading?
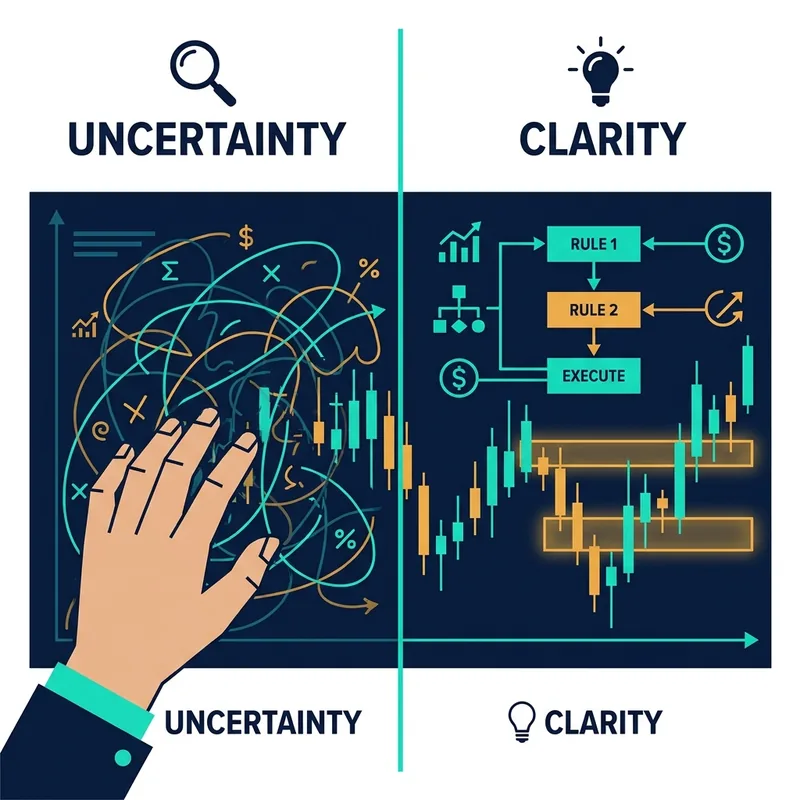
The Core Idea: Replacing Gut Feel with Defined Rules
Quantitative trading is the practice of making trading decisions based on explicit, pre-defined rules derived from mathematical models and statistical analysis of market data. Instead of reading a chart and deciding in the moment, a quant trader encodes their logic upfront: "If condition A and condition B are true, execute trade C." The system then applies those rules consistently, every time, without hesitation or second-guessing.
The contrast with discretionary trading is direct. A discretionary trader looks at the same setup twice and might act differently depending on how yesterday's trade went. A quantitative approach removes that variability — the rules are the same on Monday morning as they are after a losing streak on Friday afternoon.
What Makes a Trading Approach Quantitative?
Three elements define a quantitative approach:
- Measurable conditions — every entry, exit, and risk rule is expressed in terms that can be evaluated against market data (price, volume, indicator values, time)
- Statistical grounding — strategy logic is validated against historical data, not just assumed to work
- Systematic execution — once validated, the strategy runs without discretionary override
Quantitative trading is not exclusive to hedge funds and institutions. The underlying logic — define rules, test them, deploy them — is accessible to any trader who can articulate what they're looking for in a trade. The barrier has historically been technical: building and testing these systems traditionally required coding skills. That barrier has dropped significantly with modern tooling.
How Quantitative Trading Works: The Four-Step Process
Step 1 — Define Your Trading Logic as Explicit Conditions
Every quant strategy starts with a hypothesis: a belief about a market pattern that repeats often enough to be worth trading. The critical step is translating that belief into measurable if-then conditions.
"I think BTC tends to bounce after a sharp pullback" becomes: If RSI(14) drops to an oversold level AND price is above a long-term moving average, open a long position. The exit and stop-loss get the same treatment: Close when momentum recovers to a defined threshold OR price falls a set percentage below entry.

This translation process — from intuition to explicit logic — is the intellectual core of quantitative trading.
Step 2 — Backtest Against Historical Data
Backtesting means running your defined rules against historical market data to see how the strategy would have performed. It answers the question: does this logic have an edge, or does it just look good in theory?

A backtest produces concrete metrics — win rate, average gain per trade, maximum drawdown, risk-reward ratio — that let you evaluate the strategy objectively before risking real capital.
Step 3 — Refine Risk and Position Rules
Raw backtest results rarely represent a finished strategy. This step involves adjusting risk management parameters: position sizing, stop-loss placement, maximum concurrent trades, and drawdown limits. These rules determine not just whether the strategy is profitable in theory, but whether it's survivable in practice during losing streaks.

The feedback loop between backtesting and refinement is where most of the real work happens. You test, observe where the logic breaks down, tighten the conditions, and test again.
Step 4 — Deploy and Monitor Automated Execution
Once the strategy is validated, automated execution takes over. The system monitors the market in real time, evaluates conditions as each new candle closes, and places orders without manual intervention. Monitoring remains important — market conditions shift, and a strategy that worked well in a trending environment may need adjustment in a ranging one.
Quantitative Trading vs. Manual Trading
The honest comparison comes down to four dimensions:
Emotional bias — Manual trading is vulnerable to fear, greed, and recency bias. A losing trade can make a discretionary trader hesitant on the next valid setup; a winning streak can make them oversize. Quantitative systems apply the same logic regardless of recent outcomes.
Consistency — A quant strategy executes its rules every single time the conditions are met. A manual trader, even a disciplined one, will miss setups, second-guess entries, and exit early. Consistency is where systematic approaches have a structural advantage.
Speed of execution — Automated systems can react to conditions faster than manual execution allows. For strategies that depend on precise entry timing — breakouts, crossover signals — this matters. Manual execution introduces latency and slippage.
Scalability — A quant strategy can monitor multiple instruments or timeframes simultaneously. A manual trader is limited by attention. This makes systematic approaches naturally scalable as a trader's experience grows.
Transparency of logic — This is underrated. A well-built quant strategy makes the logic completely explicit. You know exactly why every trade was taken. Manual trading often involves reasoning that's hard to audit or improve.
Where manual trading still has a role: discretionary judgment is valuable in genuinely novel market conditions — events with no historical precedent, or highly illiquid situations where a rules-based system may behave poorly. Many experienced traders use a hybrid approach, running systematic strategies while reserving discretion for exceptional circumstances.
Common Quantitative Trading Strategies
Trend-Following and Momentum
Trend-following strategies operate on the principle that assets in motion tend to stay in motion. The logic: identify when a market has established a directional move, enter in that direction, and ride it until the trend shows signs of exhaustion.
Momentum strategies are closely related — they select or weight assets based on recent relative performance, favoring what has been strong and avoiding or shorting what has been weak. Both approaches are grounded in the observation that price trends can persist across time, though performance varies by market regime and conditions.
Common conditions in trend-following systems include moving average alignment — requiring price to be positioned above a longer-term moving average as a directional filter — breakout strategies that trigger when price clears a defined resistance level, and volume conditions that confirm the move has participation behind it.
Mean Reversion
Mean reversion strategies are built on the opposite premise: prices that deviate significantly from their average tend to return to it. When an asset appears statistically stretched — showing oversold readings on an oscillator, or sitting far from a moving average — a mean reversion system enters in anticipation of the snap-back.
The statistical underpinning is the idea of a stable long-run equilibrium. Mean reversion strategies can perform differently depending on whether the market is trending or ranging, which is why many quant traders add a trend filter to their conditions — helping avoid fading a genuine directional move when the strategy is designed for consolidating conditions.
Indicator Crossover and Signal-Based Strategies
Crossover signals are among the most widely used entry conditions in retail quantitative trading. A classic example: enter long when a shorter-period moving average crosses above a longer-period one; exit when it crosses back below. The logic is simple, fully measurable, and straightforward to backtest.
More sophisticated indicator-based entry and exit conditions layer multiple signals — for example, requiring a moving average crossover and a momentum reading above a neutral level and volume above its recent average before triggering an entry. Each additional condition filters out lower-quality setups at the cost of fewer total trades.
The Role of Backtesting in Quantitative Trading
What a Good Backtest Actually Tells You
Backtesting is non-negotiable in quantitative trading. Without it, you're deploying untested logic with real capital — which is no different from discretionary trading with extra steps.
A meaningful backtest tells you: how often the strategy wins, how large the average winner is relative to the average loser, how deep the worst drawdown goes, and how many trades the strategy generates over a given period. These metrics together give you a realistic picture of what live trading with this strategy would feel like — including the losing streaks you'd need to survive to capture the edge.
Visual backtesting tools add an important layer: you can see exactly where each rule triggered on the chart, which makes it immediately obvious whether the strategy is catching the moves you intended or firing in the wrong conditions.
Common Backtesting Mistakes to Avoid
Overfitting (also called curve-fitting) is the most dangerous backtesting error. It happens when you optimize a strategy's parameters so precisely to historical data that it performs brilliantly on past data but fails on new data — because you've essentially memorized the past rather than found a genuine edge. Signs of overfitting include strategies with dozens of parameters, suspiciously smooth equity curves, and performance that degrades sharply on out-of-sample data.
Other common mistakes:
- Insufficient data — testing on a few months of data doesn't expose how the strategy behaves across different market regimes
- Ignoring transaction costs — spreads, fees, and slippage can turn a marginally profitable strategy into a losing one
- Survivorship bias — inadvertently testing only against assets or conditions that already worked out, rather than a representative sample of what was actually tradable at the time
- Not iterating — treating the first backtest result as final rather than using it as the starting point for refinement
Tools and Platforms Used by Quant Traders
Code-Based Tools: Powerful but High-Barrier
Python is widely used in quantitative trading circles, alongside other languages and proprietary systems common in institutional environments. These code-based tools offer maximum flexibility and suit professional quant developers building complex, custom systems.
The barrier is real: building even a simple backtested strategy in code requires learning a programming language, working with data structures, and debugging logic that isn't always transparent. For traders whose edge is market knowledge rather than software engineering, this is a meaningful obstacle.
No-Code Visual Builders: Quant Logic Without Programming
No-code strategy builders apply the same quantitative workflow — define conditions, backtest, deploy — through a visual interface instead of a text editor. A drag-and-drop interface lets traders assemble entry conditions, exit rules, and risk parameters by connecting components rather than writing functions.
Quberas is built specifically for this workflow. Its deal map gives you a visual canvas where you lay out the full structure of a strategy — entries, averaging orders, take-profit, and stop-loss — as connected components. The puzzle-style condition builder supports complex nested logic: price conditions, indicator values, crossover signals, and volume conditions can be combined with AND/OR operators without writing a line of code. When you run a backtest, the platform highlights on the chart exactly where each condition triggered, so you can see the strategy's behavior directly rather than interpreting a data table.
Trading indicators are available as building blocks within the condition builder, connected directly to automated execution when the strategy goes live.
How to Get Started with Quantitative Trading (No Coding Required)
Turn Your Trading Idea into a Set of Rules
Start with a trading idea you already have — something you've noticed in the market, a setup you've been taking manually, or a pattern you've read about. The first task is making it explicit.
Write out: What has to be true for me to enter? What tells me the trade is wrong? Where do I take profit? If you can answer those three questions in specific, measurable terms, you have the raw material for a quantitative strategy. No Python or math degree required — this is a thinking exercise, not a coding exercise.
Build and Visualize the Strategy Logic
Take those if-then conditions and map them into a visual strategy builder. In Quberas, this means opening the deal map and placing your entry conditions, exit targets, and stop-loss rules as connected blocks. The condition builder lets you combine indicators and price rules with AND/OR logic without writing any syntax.

The visual representation is genuinely useful here: you can see the full structure of your strategy at a glance and catch logical gaps — like a missing exit condition — before you ever run a backtest.
Backtest, Review, and Refine
Run the backtest against historical data and read the results on the chart. Look at where the strategy entered and exited, check the win rate and drawdown figures, and identify the trades that went wrong. Were they wrong because the market was unusual, or because the logic has a flaw?
Adjust one variable at a time — tighten an entry condition, widen a stop, add a volume filter — and re-run. This iteration loop is the core of quantitative strategy development. Expect to run multiple backtests before the logic is solid enough to consider live deployment.
Launch with Automated Execution
Once the backtest results are satisfactory and the risk rules are set, connect the strategy to automated execution. The system monitors conditions in real time and places orders when the rules are met. Your role shifts from executing trades to monitoring strategy performance and deciding when conditions have changed enough to warrant revisiting the logic.
Addressing the concern directly: you do not need to be "technical enough" to do this. The quantitative workflow — hypothesis, rules, test, deploy — is a thinking framework. The tooling handles the implementation.
Frequently Asked Questions About Quantitative Trading
Is quantitative trading only for institutions? No. The workflow — define rules, backtest, automate — is applicable at any scale. Institutional quant funds have advantages in data access, execution speed, and capital, but the core methodology is the same. Retail traders have been running systematic strategies for years; modern no-code tools have made the entry point much lower.
Do I need to know Python to do quantitative trading? Not anymore. Code-based approaches remain common among professional quant developers, but no-code visual strategy builders implement the same logical framework through a drag-and-drop interface. If you can define your trading conditions in plain language, you can build and backtest a quantitative strategy without writing code.
Is quantitative trading profitable? It depends entirely on the quality of the strategy and the discipline of the process. Quantitative trading does not guarantee profits — it guarantees consistency in applying whatever logic you've defined. A well-researched strategy with sound risk management can be profitable; a poorly tested one will lose money systematically. The edge comes from the quality of the idea and the rigor of the backtesting process.
What is the difference between quantitative trading and algorithmic trading? The terms are often used interchangeably, and the distinction isn't always clear-cut. Generally, algorithmic trading strategies refer to any automated execution of trading rules. Quantitative trading refers more specifically to strategies derived from mathematical models and statistical analysis of market data. In practice, many traders use both terms to describe the same rules-based, systematic approach.
Can retail traders use quantitative strategies? Yes, and many do. Trend-following, mean reversion, and crossover-based strategies are all well-suited to retail trading on liquid markets. The key requirements are a clearly defined edge, a properly backtested set of rules, and disciplined risk management — none of which require institutional infrastructure.
Ready to apply quant principles to your own trading ideas? Build, backtest, and visualize your first strategy on Quberas — no code required.