Meta Market Cap Explained | Quberas
Meta Platforms' market capitalization is approximately $1.5 trillion as of early 2025, based on roughly 2.53 billion shares outstanding trading near $610 each. That number is a snapshot, not a fixed fact — it moves every time META's stock price changes — but understanding how it's built, how it's moved historically, and where it sits among the world's most valuable companies tells you far more than the figure alone.
What Is Market Cap?
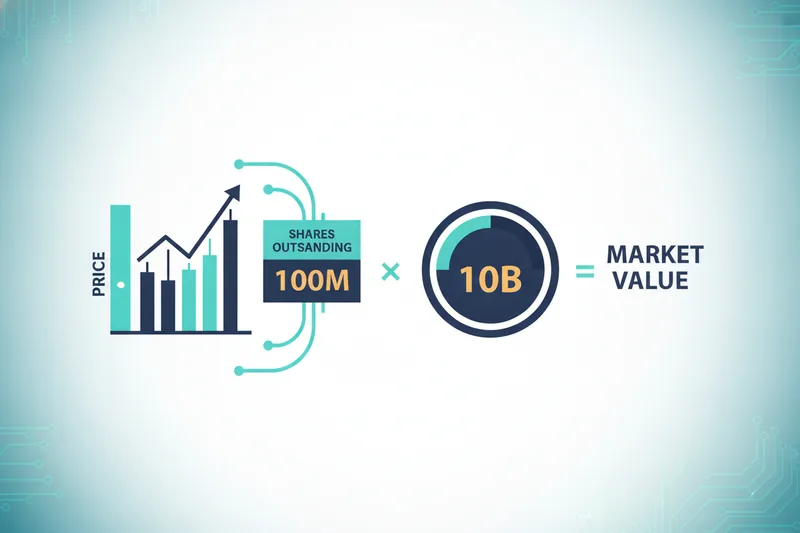
Market capitalization (market cap) is a company's total value as priced by the stock market: shares outstanding multiplied by the current share price. It's a proxy for size and investor confidence, not a measure of cash in the bank or assets owned — two companies with identical revenue can have very different market caps if investors expect different growth paths.
Market cap is the standard yardstick used to rank companies, which is why a trillion-dollar company — one whose shares outstanding times share price crosses $1,000,000,000,000 — gets treated as a milestone. Only a handful of firms globally have sustained that mark, and Meta has moved above and below it multiple times over the past decade depending on how its stock has traded.
How Is Meta Platforms' Market Cap Calculated?
For Meta Platforms (META), the calculation is the same formula applied to any public company: shares outstanding × current stock price. With roughly 2.53 billion shares outstanding and a stock price near $610, Meta's market cap works out to about $1.54 trillion at that moment.
Two inputs move this number. The stock price changes continuously during market hours as buyers and sellers trade. Shares outstanding changes far less often — mainly through stock buybacks, which reduce the count, or new share issuance, which increases it. Meta has run large, recurring buyback programs, which has pushed its share count down over time even in years when the underlying business kept growing — one reason market cap and revenue growth don't always move in lockstep.
Meta's Current Market Cap and Key Stock Stats
Here's Meta's snapshot as of early 2025 — treat these as a point-in-time reference, since price-driven figures shift daily:
- Market cap: approximately $1.5 trillion
- Stock price: approximately $610
- Shares outstanding: approximately 2.53 billion
- P/E ratio (price-to-earnings): approximately 27, meaning the stock trades at roughly 27 times its trailing annual earnings per share
- Dividend yield: approximately 0.3%, based on the quarterly dividend Meta introduced in February 2024
- Ticker: META, the symbol under which the stock trades on Nasdaq
The P/E ratio and dividend yield move with both price and reported earnings, not just price alone, so they can shift between quarterly earnings reports even when the stock price is flat.
Meta Market Cap History: Chart and Year-by-Year Breakdown (2012–2026)
Meta (then Facebook) went public in May 2012 and, like many newly listed tech stocks, swung considerably in its first year before settling into sustained growth through the mid-to-late 2010s as advertising revenue scaled.
Meta market cap by year
| Year | Approximate market cap | Context |
|---|---|---|
| 2012 (IPO) | ~$82 billion | First trading day close |
| 2015 | ~$296 billion | Mobile ad revenue scaling |
| 2018 | ~$375 billion | Cambridge Analytica fallout weighed on the stock |
| 2021 (peak) | ~$1.08 trillion | All-time high before the 2022 reset |
| 2022 (trough) | ~$230 billion | Steepest single-year decline as a public company |
| 2023 | ~$800 billion | Recovery began |
| 2024 | ~$1.7 trillion | Buybacks and ad growth pushed valuation to a new high |
Figures are rounded approximations based on year-end or peak closing prices; exact values depend on the specific trading day used. Through 2025 and into 2026, Meta's valuation trajectory depends on ad revenue trends and AI infrastructure spending, both of which are still unfolding rather than settled history.
What caused the 2022 drop in Meta's valuation?
Meta's stock fell roughly 64% over 2022, its worst year on record as a public company, taking market cap from around $935 billion at the start of the year to about $230 billion at the November trough. The drivers were a slowdown in advertising revenue growth, interest-rate hikes that compressed valuations across growth-oriented tech stocks broadly, and investor skepticism about heavy Reality Labs and metaverse spending without a clear near-term payoff. The recovery began in 2023 as the company cut costs, slowed hiring, and ad revenue growth returned.
Meta's Ranking Among the World's Most Valuable Companies
Among the world's most valuable public companies, the approximate order as of early 2025 is:
- Apple — ~$3.5 trillion
- Nvidia — ~$3.3 trillion
- Microsoft — ~$3.1 trillion
- Alphabet — ~$2.1 trillion
- Amazon — ~$2.0 trillion
- Meta Platforms — ~$1.5 trillion
This order rotates regularly — a strong earnings quarter for any one of these companies can reshuffle the ranking within weeks, and Nvidia and Apple in particular have traded the top spot back and forth. Meta's position has climbed steadily since the 2022 trough but hasn't yet reached the very top tier occupied by Apple, Nvidia, and Microsoft.
What If You Invested $10,000 in META 10 Years Ago?
In February 2015, Meta (then Facebook) traded at approximately $80 per share. A $10,000 investment at that price would have bought about 125 shares. At today's price of roughly $610, those 125 shares would be worth approximately $76,250 — a gain of about $66,250, or roughly 663%, before accounting for the dividend Meta began paying in 2024.
That outcome depends entirely on the entry date. Someone who bought at the 2021 peak near $382 and held through the 2022 crash would have seen the position lose more than 70% of its value before recovering. This is the core lesson behind the number: the same stock produces wildly different returns depending on when a rules-based system would have entered and exited.
Turning Market Cap Trends Into Backtestable Trading Signals
Reading Meta's valuation history is useful research, but it's still a step removed from a tradeable decision. The gap between "the stock dropped 64% in 2022" and "here's a rule that would have acted on that" is where most retail traders get stuck — they either trade on gut feel when they notice a big valuation swing, or they never systematize the observation at all.
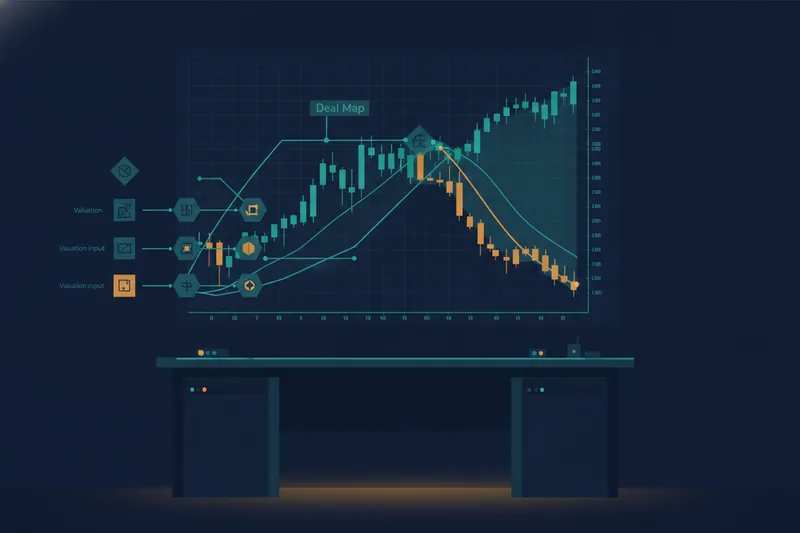
Quberas is a no-code strategy builder designed to close that gap. You define conditions around price action, moving averages, or volume shifts — the same signals that show up around large-cap drawdowns like Meta's 2022 decline — and lay them out as a deal map: a visual sequence covering entry conditions, averaging orders, exits, and stop-losses, so the whole strategy's logic stays visible instead of buried in parameters or code.
Once the logic is built, the visual debugger highlights the exact chart zones tied to each condition, so you can see where a rule would have triggered — or almost triggered — historically, and adjust thresholds before committing capital. From there, backtesting runs the strategy against historical data to check how it would have performed; treat this as one required step alongside forward testing on current conditions, not a final verdict, before considering a strategy ready for live use.
FAQ: Meta Market Cap Questions Answered
Is Meta worth $2 trillion? Not yet as of early 2025 — Meta's market cap sits around $1.5 trillion. Its closest approach to $2 trillion has been its current level near $1.5 trillion, the highest market value the company has reached; it would need sustained price gains from current levels to cross the $2 trillion mark.
Who is #1 by market cap? Apple, at approximately $3.5 trillion as of early 2025, though Nvidia has briefly taken the top spot during strong AI-driven rallies. The order between Apple, Nvidia, and Microsoft shifts often enough that any snapshot is temporary.
How often does market cap change? Continuously during market trading hours, since it's recalculated every time the share price ticks. Shares outstanding changes far less frequently — typically only when a company executes a buyback or issues new stock.
If watching Meta's market cap has you thinking beyond research and toward a systematic approach, see how Quberas lets you turn valuation and volatility signals like Meta's market cap swings into a visual, backtestable trading strategy — no code required.