Best Indicators for Crypto Trading Bots | Quberas
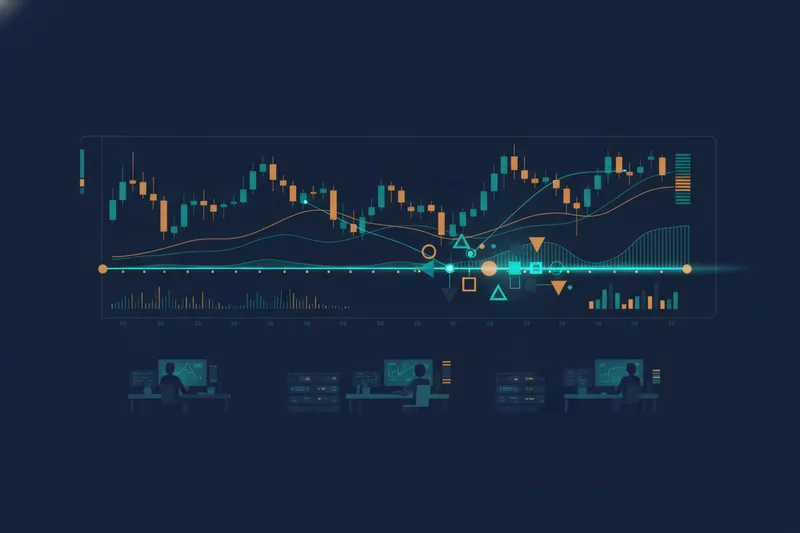
Choosing the "best" indicators for a crypto trading bot isn't about finding a magic formula — it's about picking indicators you can turn into a precise, testable rule: a specific price relationship, threshold, or crossover that a bot can check on every candle without hesitation or interpretation. Trend indicators (moving averages, MACD, Supertrend) tell a bot which direction the market is leaning. Momentum indicators (RSI, Williams %R) flag when a move is overextended. Bollinger Bands measure volatility. Volume confirms whether a signal has real conviction behind it. None of these are reliable in isolation — what makes them work in a bot is how you combine them into nested logic and prove that combination on historical data before it touches real capital.
What Makes a Good Indicator for a Crypto Trading Bot?
An indicator is a mathematical calculation applied to price, volume, or order data that produces a value or line you can act on — an EMA, an RSI reading, a band width. A trading bot is software that executes buy and sell orders automatically once its conditions are met, without a human confirming each trade in the moment. That distinction matters more than it sounds: when you trade manually, you can glance at an indicator and use judgment about context — news, market feel, a hunch that a signal looks weak. A bot can't do that. It needs rule-based logic, not discretionary trading — a condition that's either true or false, like "EMA(9) crosses above EMA(21)" or "RSI(14) drops below 30."
This is also where crossovers — the point where one line crosses another, such as a fast moving average passing a slow one — become so central to bot design. They're one of the few indicator behaviors that translate cleanly into a yes/no trigger.
Rather than coding these conditions by hand, a platform like Quberas lets you connect indicators visually and define the exact condition, then see directly on the chart where it would have fired — which is the only way to know if a rule is actually well-formed before you rely on it.
To keep the rest of this guide organized, indicators fall into four functional groups: trend (direction), momentum (timing and exhaustion), volatility (range and risk), and volume (confirmation). A good bot strategy usually draws from at least two of these groups, because a single category answers only part of the question "should I trade right now." It also helps to hold indicator choices to a measurable bar — for example, treating a backtested Sharpe ratio above 1.0 as an acceptable baseline and above 2.0 as strong performance, rather than judging a strategy by how convincing its logic sounds.
Trend Indicators: Moving Averages, MACD, and Supertrend

Trend indicators answer one question: which direction is the market currently favoring? They're the backbone of most bot logic because they define the bias the rest of your rules operate within.
Moving Average (MA/EMA) Crossovers
A Moving Average (MA) smooths price over a set number of periods; an EMA (exponential moving average) weights recent candles more heavily, so it reacts faster. A bot rule typically watches for a crossover — fast EMA over slow EMA for a long entry, the reverse for an exit or short. On very short timeframes, such as the 1-minute to 15-minute charts used in scalping, price whips through these crossovers constantly, generating more noise than signal, so shorter EMAs generally suit faster strategies while longer periods (50/200) fit swing-style bots better.
MACD Signal Crossovers
MACD (Moving Average Convergence Divergence) plots the difference between two EMAs against its own signal line. A bot condition here is usually "MACD line crosses above signal line" for bullish momentum, or the histogram flipping from negative to positive. It's slower to react than a raw EMA crossover, which makes it useful as a confirmation layer rather than a standalone trigger.
Supertrend for Trend-Following Bots
Supertrend plots a line above or below price based on volatility (using average true range), flipping sides when the trend reverses. Because it produces a clean binary state — price above the line or below it — it's one of the easier trend indicators to wire into a bot as a standing filter: only take long entries while Supertrend is bullish, for instance.
Momentum Indicators: RSI and Williams %R
Relative Strength Index (RSI) measures the speed and size of recent price moves on a 0–100 scale; readings above 70 typically flag overbought conditions, below 30 oversold. Williams %R does something similar but is scaled from 0 to -100 and reacts faster, which makes it more sensitive — and more prone to false signals — than RSI.
This is the core problem with momentum indicators in a bot: a raw "RSI below 30, buy" rule fires constantly in a strong downtrend, because oversold doesn't mean reversal. This is where threshold tuning matters — adjusting the exact level, the number of periods, or requiring the condition to hold for several candles rather than firing on the first touch. It's also worth pairing a momentum trigger with an explicit risk rule rather than treating the indicator as the whole strategy — for example, capping risk on any single trade at a fixed percentage of capital, so a bad momentum read doesn't do outsized damage. Reducing false signals — trades triggered by noise rather than a genuine shift — is less about finding a better indicator and more about testing where your current thresholds are too loose.
Volatility Indicators: Bollinger Bands
Bollinger Bands plot a moving average with two bands above and below it, spaced by a multiple of standard deviation — a statistical measure of how spread out price moves are. When bands widen, volatility is rising; when they contract (a "squeeze"), the market is compressing, often before a bigger move. Bots typically use bands in one of two ways: a breakout rule (price closes outside a band, suggesting a strong move), or a mean-reversion rule (price touches a band and snaps back toward the average). Which one to use depends on the asset's behavior — trending crypto pairs tend to reward breakout logic, while range-bound pairs favor reversion — and that's something you should confirm with historical data rather than assume.
Volume Indicators: Confirming Signal Strength
Volume indicators — such as a simple volume moving average, or on-balance volume — don't generate entries on their own in most bot designs. Their job is signal confirmation: filtering out trend or momentum signals that lack real participation behind them. A moving average crossover on thin volume is far more likely to fail than the same crossover accompanied by a volume spike. Adding a volume condition — "only trigger if volume exceeds its 20-period average" — is one of the simplest ways to cut down on false, noise-driven entries without changing your core trend or momentum logic at all.
How to Combine Indicators for a Trading Bot Strategy
Individual indicators are rarely enough. The reliable pattern is nesting conditions from different categories so each one filters the others: a trend indicator sets the bias, a momentum indicator times the entry, and volume confirms it. A concrete example: enter long only if Supertrend is bullish AND RSI crosses back above 30 from below AND volume is above its 20-period average. That's three nested conditions, not one indicator doing all the work.
This is what a deal map is for — a visual layout of a strategy's stages, from entry through averaging orders (additional buys at set intervals or price deviations to improve an average entry) to exit and stop-loss logic, connected so you can see the whole flow rather than a wall of parameters. A condition builder lets you assemble the nested logic above — price, indicator, volume, crossover — without writing it as code, and inspect each branch independently. Other automation platforms take a narrower approach here: some, like 3Commas, offer signal bots that execute trades from external alerts rather than a visually nested rule set — workable, but harder to audit than seeing the actual logic on a chart. Whichever approach you use, the underlying workflow — connecting a market-data feed, an execution layer, and a way to review what happened — is the same three-part structure most serious trading setups rely on.
How to Backtest and Debug Indicator-Based Strategies Before Going Live
Backtesting runs your rule set against historical data to see how it would have performed — the only real check on whether an indicator combination works, as opposed to just sounding plausible. Basic backtests use OHLCV data (open, high, low, close, volume per candle); more precise validation adds order-book-derived data, which reflects actual bid/ask depth rather than just the printed trade price, useful for strategies sensitive to slippage or thin liquidity. Backtesting alone isn't the final word, though — forward testing, running the strategy live on current data without committing real capital, is generally treated as an equally necessary step before risking money, not an optional extra.
A visual debugger goes further than a backtest summary by showing exactly which chart zones satisfied each condition — and, just as usefully, where a condition came close but didn't trigger. That "almost vs. triggered" view is often how you catch a threshold set too tight or too loose: if RSI kept approaching 30 but never quite crossed it during an obvious reversal, that's a concrete reason to loosen the threshold rather than guess. It's also worth testing a rule set against more than one market condition — range-bound, trending, and breakout periods behave differently enough that a strategy validated only in one can fail outside it.
From Indicators to a Live Bot: Building or Launching Your Strategy
Once an indicator combination backtests and forward-tests well, there are two practical paths. Building a multi-stage trading bot from scratch means laying out entry, averaging, exit, and stop-loss logic as a deal map inside a no-code strategy builder — no programming required, similar in spirit to other drag-and-drop builders in the space, as opposed to code-first environments that require scripting the same logic in Python or a similar language. Automated trading tools broadly split into full development environments, no-code/low-code builders, signal-to-execution tools, and pre-built bot marketplaces — worth knowing so you pick the category that matches how much control versus speed you want.
The second path is starting from a ready-made strategy marketplace — selecting an existing, published strategy, setting your own risk parameters, and testing it before committing capital, rather than building indicator logic from zero. Either way, risk controls — position sizing, stop-loss placement, cooldown periods after a loss — belong at the strategy level, not as an afterthought bolted on after the indicators are chosen.
FAQ: Choosing and Trusting Indicators for Crypto Bots
Are crypto trading bots successful? Success depends far more on the rules and risk controls than on any single indicator. It also depends on timing relative to the broader market: Bitcoin's bull-to-bear cycles have historically run in roughly four-year intervals since 2011, so a strategy validated only on one part of a cycle may behave very differently in another — another reason to backtest across multiple periods rather than one recent stretch.
What is the most profitable crypto trading bot? There isn't a single indicator or bot template that holds up as universally "most profitable" — profitability is specific to the rules, the asset, and the period tested. Even bot types differ in what they're designed to do: a DCA (dollar-cost-averaging) bot, for instance, buys or sells at regular intervals over a set schedule rather than reacting to indicator signals at all. The honest answer is to test a specific rule set on specific data rather than search for a bot with a fixed profitable formula.
Can ChatGPT code a trading bot? Large language models can be connected to trading infrastructure that supplies live market feeds, historical data, and order execution, so technically, yes, generated code can run a bot. But you're still trusting logic you didn't build condition-by-condition and can't necessarily see triggering on a chart — which is the opposite of the transparency this article has been arguing for.
Why not just trust a "magic" indicator? Because proprietary, black-box measures — like a sentiment index calculated internally by its provider rather than from a rule you can inspect — can't be rebuilt or audited the way a moving average crossover or RSI threshold can. Transparency, not mystique, is what makes an indicator trustworthy as bot logic: you should be able to see exactly why a trade fired, on the chart, every time.
Start building your indicator-based strategy visually with Quberas's no-code condition builder — test it on historical data before you go live.