Calculate ROI on Trading Bot: Step-by-Step Guide

What ROI Means for a Trading Bot (and How It Differs From Standard Investing ROI)
ROI (return on investment) for a trading bot is calculated the same way it is for any investment: ROI = (Net Profit / Total Cost) x 100. The number itself is simple. What's hard is getting the inputs right, because a bot's "cost" and "profit" aren't as clean as a single stock purchase.
A trading bot is software that opens and closes positions automatically based on a rule set — an algorithmic trading strategy — rather than a human clicking buy or sell. That rule set can be one condition ("buy when RSI crosses below 30") or a multi-stage sequence with entries, averaging orders, exits, and stop-losses. Each of those stages can contribute or subtract profit independently, which is why a bot's ROI figure hides more detail than a buy-and-hold return does.
The other complication is the gap between gross profit (the sum of winning trades before any costs) and net profit (what's left after subscription fees, trading fees, and slippage are deducted). A bot can show an impressive gross number and a mediocre — or negative — net one. Retail access to this kind of systematic, rule-based execution used to sit mostly with institutional desks; it's now common for individual traders to build and run these strategies themselves. When a strategy is built from nested conditions — an entry, an averaging order, an exit, a stop-loss — it isn't obvious from one P&L line which stage actually made or lost the money. Quberas approaches this by laying the strategy out as a visual deal map, so each stage's trigger and its outcome sit on the same chart instead of buried in a spreadsheet.
The ROI Formula for Trading Bots and the Costs That Feed It
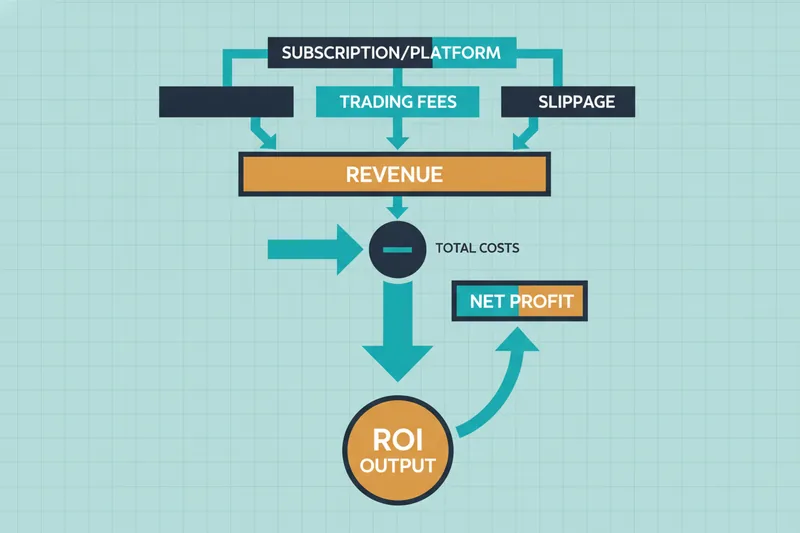
The formula doesn't change: ROI = (Net Profit / Total Cost) x 100. What changes for a bot is everything that has to be subtracted before you arrive at net profit. Three cost categories consistently get underestimated.
Subscription and platform fees
If you pay a monthly fee for the bot-building or hosting platform, that's a fixed cost regardless of how many trades run. It has to be allocated across the testing or trading period you're measuring — a $49/month subscription is $588 across a year, and it counts against profit whether the bot trades once or a thousand times.
Trading and exchange fees
Every filled order — entry, averaging add, exit — carries a maker or taker fee on the exchange. A strategy with frequent averaging orders can rack up meaningfully more in fees than a simple single-entry, single-exit trade, even if the gross profit looks similar.
Slippage and execution costs
Slippage is the difference between the price your rule expected and the price you actually got filled at, usually because of order book depth or latency at the moment of execution. It's the cost most traders forget to model, and it's also the single biggest reason a backtest number and a live number won't match.
Step-by-Step: Calculating ROI on a Trading Bot
Pulling net profit and total cost from a backtest report
Start from a backtesting run — simulating the strategy against historical price data to see how it would have performed. A usable backtest report should give you: gross profit, number of trades, fees paid, and any modeled slippage. Some platforms, including code-based ones like AlgoBuilder, generate this kind of build-backtest-deploy report through scripted strategies rather than a visual interface; no-code builders such as Tradetron produce the same kind of output through a drag-and-drop strategy design instead of code.
Applying the ROI formula to a single strategy run
- Take gross profit from the backtest.
- Subtract exchange/trading fees for every filled order (entries and averaging orders included).
- Subtract the subscription cost allocated to the test period.
- Subtract modeled slippage.
- That result is net profit. Divide it by total cost (capital allocated + fees + subscription) and multiply by 100.
On a deal map, this maps directly to structure: the entry condition and any averaging orders determine how much capital and fee exposure the trade accumulates before the exit or stop-loss condition closes it. If you're sizing risk per trade, a common reference point is capping risk at roughly 3% per individual position and 5% across all open positions simultaneously — figures worth applying before you scale a backtested strategy into live capital.
Backtested ROI vs Live ROI: Why They Diverge
A strategy that shows 18% ROI in a backtest and 6% live isn't necessarily broken — but the gap needs an explanation, not a shrug. Three sources account for most of it:
- Slippage and order execution differences: backtests often assume fills at the exact signal price; live markets fill at whatever price is available when the order reaches the book.
- Data quality and timing: some data feeds stream real-time quotes, others deliver delayed or end-of-day bars — if your backtest ran on coarser data than your live feed, the two aren't measuring the same thing.
- Market conditions changing: volatility, liquidity, and correlation regimes shift after the backtest window ends, so a rule tuned to one regime can behave differently in the next.
This is also why forward testing — running the strategy live with minimal or demo capital before committing full size — is treated as a required step alongside backtesting, not an optional extra. If you trade through a funded or prop account, check the account's specific drawdown rules too; some, like Topstep, calculate against end-of-day balances rather than a trailing intraday drawdown, which changes how close a live strategy actually sits to a stop-out versus what a backtest would suggest.
Annualizing and Comparing ROI Across Time Periods
Raw ROI numbers are only comparable if the time periods match. A strategy that returns 8% over three months isn't performing worse than one returning 10% over a year — it's performing much better, annualized.
Annualized ROI (often expressed as CAGR, or compound annual growth rate) normalizes returns to a one-year basis:
Annualized ROI = ((1 + Total ROI)^(365 / Days Held) - 1) x 100
If a bot returned 8% over 90 days: (1.08)^(365/90) - 1 ≈ 39.5% annualized. That's the number to use when comparing a 3-month backtest against a 12-month one, or against a competing strategy tested over a different window. Never compare raw ROI figures side by side unless the holding periods are identical.
Beyond Raw ROI: Win Rate, Profit Factor, and Risk-Adjusted Return
A high ROI can mask a fragile strategy. Three supporting metrics tell you whether the return is durable.
Win rate is the percentage of trades that close profitably. Profit factor is gross profit divided by gross loss — a strategy with a 40% win rate can still have a strong profit factor if winners are large relative to losers. Neither should be read alone; a high win rate with a poor profit factor usually means small frequent wins are being wiped out by rare large losses.
Risk-adjusted return metrics like the Sharpe ratio (return per unit of volatility) and drawdown (the peak-to-trough decline in account value) round out the picture. A Sharpe ratio above 1.0 is generally considered acceptable, above 2.0 very good, and above 3.0 excellent. Some risk frameworks also set a minimum profit-to-loss ratio — the "7%" in the well-known 3-5-7 rule refers to this ratio, not a percentage return target. And don't assume your quoted execution price is the full cost: some brokers build a markup into the price itself, beyond the raw spread, which quietly reduces profit factor even when slippage looks fine on paper.
Example ROI Calculations for Crypto and Futures Trading Bots
Example: a crypto averaging-order bot
A crypto trading bot enters a position, adds to it via averaging orders if price moves against it, then exits on a recovery target. Note the distinction: a classic DCA (dollar-cost-averaging) bot buys or sells at fixed time intervals regardless of price, while an averaging-order strategy adds specifically as price drops to improve the entry — the cost accounting is similar, but the trigger logic differs.
Suppose over one month: gross profit $420, exchange fees $38, subscription allocation $12, modeled slippage $15. Net profit = 420 − 38 − 12 − 15 = $355. Total cost (capital + fees + subscription) = $2,000 + 38 + 12 = $2,050. ROI = (355 / 2,050) x 100 ≈ 17.3% for the month, or roughly 1,100%+ annualized using the CAGR formula above — a reminder that short windows exaggerate annualized figures and should be treated cautiously.
Example: a futures bot with a stop-loss stage
A futures trading bot with an entry, no averaging, and a hard stop-loss over one quarter: gross profit $1,100, exchange fees $60, subscription allocation $37, slippage $40. If the strategy was licensed from a marketplace with a performance fee — commonly 10–20% of net profit on comparable copy-trading arrangements — that fee comes off next. Net profit before performance fee = 1,100 − 60 − 37 − 40 = $963. After a 15% performance fee: 963 − 144.45 = $818.55. On $5,000 capital plus fees, ROI ≈ 15.6% for the quarter, roughly 74% annualized.
Common Mistakes When Calculating Bot ROI
- Ignoring subscription and fee costs. A bot that "made $500" but cost $150 in fees and subscriptions delivered $350 — always net it out before calling it a return.
- Comparing non-annualized periods. A 6-month ROI and a 12-month ROI are not the same unit; normalize both before deciding which strategy performed better.
- Over-trusting backtested ROI. Treat a backtest as a hypothesis, not a guarantee — confirm it holds up in forward testing before scaling capital.
- Not accounting for slippage. Even a small per-trade slippage compounds across dozens of averaging orders and exits over a full trading period.
FAQ: What Counts as a Good ROI for a Trading Bot?
What does a 10% ROI mean? For every $1,000 of cost (capital plus fees and subscriptions), the strategy returned $100 in net profit over the period measured. Whether that's good depends entirely on the time window — 10% in a month is very different from 10% in a year.
What does a 20% ROI mean? Same logic, doubled: $200 net profit per $1,000 of cost. Always check the holding period before comparing it to another bot's headline number.
What's a good ROI benchmark for a trading bot? There's no universal figure, because it depends on bot type and risk taken. Bots vary — DCA, grid, and signal-based bots (some platforms, like 3Commas, offer signal bots alongside DCA and grid bots) — and automated trading tools broadly split into full coding environments, no-code builders, signal-to-execution layers, and pre-built marketplaces. A more reliable check than raw ROI alone is pairing it with a Sharpe ratio above 1.0 and a drawdown you can tolerate.
Do I need special infrastructure to hit these numbers live? Not for testing — a home PC works fine for backtesting and early forward testing. For running a bot live around the clock, most serious traders move to a VPS, since a home setup's failure modes (power loss, internet drops) become a real risk to a strategy that needs to catch every exit and stop-loss condition.
The most trustworthy way to answer "is this ROI good enough" is to see the calculation, not just the headline number. Build and backtest your own strategy's real ROI on Quberas — see exactly which condition on the deal map drives profit or loss before you risk a single dollar live.