Breakout Trading Explained: Automate Without Code

Breakout trading means entering a position the moment price pushes through a defined support or resistance level with enough force to suggest the move will continue, rather than reverse. It's one of the most widely used strategies in technical trading because it turns a visible, repeatable chart event into a rule-based signal — but only if you can define "enough force" precisely, confirm it isn't a trap, and manage the trade once you're in. This guide walks through the mechanics, the indicators that separate real breakouts from noise, the common setups, and how to turn the whole process into a system you can backtest and run automatically instead of watching charts all day.
What Is Breakout Trading?
Breakout trading is a strategy built on a simple premise: when price moves decisively past a level it has previously struggled to cross, that move often marks the start of a new trend rather than a temporary spike. The trader's job is to define what "decisive" means in measurable terms — price, volume, and time — and act on it consistently rather than case by case.
Support and Resistance Levels Explained
Support and resistance are price zones where an asset has historically reversed or stalled. Support is a floor where buying pressure has previously outweighed selling; resistance is a ceiling where selling has capped further gains. These levels aren't exact lines so much as zones, formed by prior highs, lows, or areas of heavy trading activity. A breakout occurs when price action — the raw movement of price on the chart — pushes through one of these zones and holds beyond it instead of bouncing back.
Why Breakouts Signal Potential New Trends
A level holds because, at that price, more traders have historically wanted to sell than buy (resistance) or buy than sell (support). When price finally clears that level, it implies a shift in that balance — new buyers overwhelming old sellers, or vice versa. That shift is often visible first in specific chart patterns: rectangles, triangles, channels, and other shapes that show price compressing before it releases. Traders who spot breakouts manually are essentially trying to catch that shift the moment it happens, which is difficult to do consistently by eye — it's a large part of why traders eventually look to systematize the process, which is the gap a platform like Quberas is built to close by letting you define breakout rules visually instead of reacting to the chart in real time.
How Does a Breakout Trading Strategy Work?
A breakout strategy is really a chain of conditions: something must trigger the entry, something must confirm it's real, and something must define when to get out.
Entry Triggers and Confirmation
The entry trigger is usually a price condition — close above resistance, or below support, by a set margin. But price alone is a weak signal on its own; a candle can poke through a level and reverse just as fast. That's why breakout confirmation typically layers in a second condition, most often volume, before the entry counts as valid. Entry and exit rules are the explicit if-then statements that define this: "if price closes above resistance AND volume exceeds its 20-period average, then enter." Technical indicators — moving averages, RSI, Bollinger Bands, and similar tools calculated from price and volume — are commonly added at this stage to filter out weak signals.
Where Exit and Stop Logic Fits In
Exit logic isn't an afterthought bolted on after the entry — it's part of the same rule set. A breakout trade needs a defined stop-loss level before entry (typically just back inside the broken level), a profit target or trailing exit, and, ideally, a time-based rule for trades that stall without moving. Building these as separate, disconnected decisions is where manual traders lose consistency; treating them as one continuous flow — entry, management, exit — is what makes a strategy systematic rather than reactive.
Key Indicators and Signals for Spotting Breakouts
Spotting a breakout is easy; spotting one worth trading is not. A handful of indicators do most of the work of separating the two.
Volume-Based Signals
Volume confirmation — checking that trading volume rises meaningfully as price breaks a level — is the most common filter breakout traders use. A level breaking on thin volume is far more likely to be a false move than one breaking with a visible spike above average turnover, since it suggests few participants are actually behind the move.
Volatility and Momentum Indicators
Volatility indicators like Bollinger Bands (bands that widen and narrow around price based on recent volatility) and the Average True Range help identify when a market has compressed enough to make a breakout meaningful — a breakout out of a tight range carries more weight than one out of an already-volatile market. Momentum indicators such as RSI or MACD are often layered on top to confirm that the move has real directional force behind it, not just a single outsized candle.
Common Breakout Trading Strategies
Breakout trading isn't one setup — it's a family of setups, each built around a specific chart pattern. Breakout trading itself sits alongside range trading, trend trading, and gap trading as one of several distinct approaches day traders use, and it can overlap with any of them depending on the pattern involved.
Range and Consolidation Breakouts
The simplest version: price trades sideways between a defined support and resistance band, and the strategy triggers when price clears either edge with confirmation. This works well on assets that spend long stretches consolidating before a directional push.
Triangle, Flag, and Wedge Breakouts
Triangles (converging trendlines), flags (short, parallel-channel pauses after a strong move), and wedges (converging lines that slope against the prior trend) are all consolidation shapes that precede a breakout. Each has a slightly different implied target and reliability profile, but the entry logic is the same: define the pattern's boundary, wait for a confirmed break of it, and enter in the direction of the break.
How to Avoid False Breakouts
A false breakout happens when price clears a support or resistance level, triggers entries, and then reverses back inside the range — leaving breakout traders stopped out just as the "real" move begins in the other direction. False breakouts happen because a single close beyond a level doesn't guarantee sustained participation; it can be driven by a stop-hunt, a low-liquidity spike, or a single large order rather than genuine trend change.
Two techniques reduce false-breakout risk substantially. First, volume confirmation, already discussed above — a break without expanding volume is a warning sign, not a green light. Second, retest confirmation: waiting for price to break the level, pull back to retest it as new support or resistance, and hold, before entering. This costs some of the early move but filters out a large share of breakouts that don't hold. Combining both — volume on the initial break, plus a held retest — is the most common way experienced breakout traders raise their win rate at the cost of slightly later entries.
Risk Management and Stop-Loss Placement
Breakout trades carry a specific risk profile: when they work, they tend to move fast; when they fail, they often fail immediately. That makes stop-loss placement — deciding in advance where you'll exit if the trade goes wrong — non-negotiable rather than optional.
The standard placement for a breakout stop is just inside the broken level: below resistance-turned-support for a long breakout, above support-turned-resistance for a short. Placing it further away to "give the trade room" usually just means taking a larger loss when the breakout fails, without meaningfully improving the odds it succeeds. Risk management at the trade level also means sizing the position so that a stop-out costs a fixed, small percentage of the account, not a fixed number of shares or contracts. On the execution side, most breakout stops are placed using standard stop-loss orders, alongside market and limit orders for entries and targets — these three remain the most common order types traders use to execute the strategy. Position sizing — calculating trade size from the distance to your stop rather than a flat amount — keeps a string of false breakouts from doing outsized damage to the account.
Automating Breakout Rules Without Code
Everything above — entry trigger, confirmation filter, stop, exit — is a set of explicit rules. That's precisely what makes breakout trading well suited to automation: there's no discretion required once the rules are defined, only consistent execution. Automated trading platforms broadly fall into a few categories: full coding environments, no-code or low-code builders, signal-to-execution tools, and marketplaces of pre-built bots. Some, like AlgoBuilder, structure the build-backtest-deploy workflow but still expect the trader to write code such as Python to define the logic; others, like Tradetron, use a drag-and-drop interface specifically so traders can build a strategy without programming knowledge.
Building Entry and Exit Conditions Visually
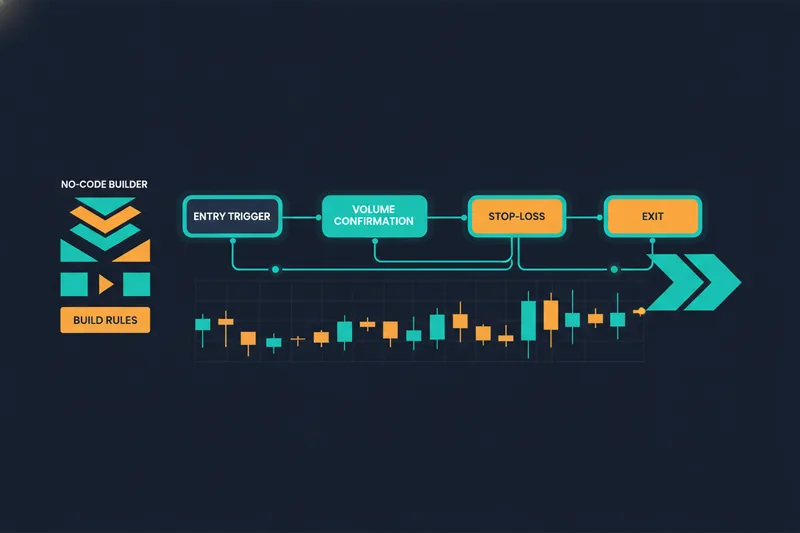
A no-code strategy builder lets you construct the same entry, confirmation, and exit logic described earlier without writing a script. In Quberas, this takes the shape of a deal map — a visual flow where each stage of the strategy (entry condition, any averaging orders, exit, stop-loss) is a connected block you configure directly, rather than a line in a codebase. A breakout rule becomes a chain you can see: price condition, volume condition, entry, stop placement, exit target — each one a node on the map. It's worth distinguishing this from a DCA bot, which automatically buys or sells at fixed intervals over a set time frame rather than reacting to price conditions; a breakout deal map is condition-driven throughout, not schedule-driven.
Seeing "Almost Triggered" vs "Triggered" Zones
The harder part of manual breakout trading is tuning thresholds — how much above resistance is "enough," how much volume expansion counts as confirmation. A visual debugger addresses this by highlighting the exact chart zones tied to each condition in your deal map, showing not just where a rule fired but where it came close and didn't. Seeing the difference between "almost triggered" and "triggered" directly on historical price data is how you tighten a volume or price-margin threshold without guessing — replacing the trial-and-error of watching live charts with a direct view of where your own rules would have acted.
Backtesting a Breakout Strategy
Before risking capital on a breakout strategy, it needs to be tested against history — and, separately, against forward-moving live conditions once backtesting looks promising, since both stages are generally treated as necessary steps, not interchangeable ones. Backtesting runs your defined rules against historical price data to see how they would have performed, which is the only reliable way to judge whether a breakout definition (the margin above resistance, the volume threshold, the stop distance) actually holds up across many instances rather than the handful you remember.
The quality of the backtest depends on the data behind it. OHLCV data — open, high, low, close, and volume for each period — is the baseline and is sufficient for most volume-confirmation and price-level rules. For strategies sensitive to exact fill quality or short-term liquidity around a breakout, order-book data, which captures live buy and sell orders at each price level rather than just period summaries, gives a more precise picture of how an entry would actually have executed. Running the same breakout logic with small variations — different volume multipliers, different retest requirements, different stop distances — and comparing results side by side is how you find which version of the rule set actually performs best, instead of committing to the first one that looked reasonable.
Is Breakout Trading Profitable?
Breakout trading can be profitable, but the honest answer is that profitability depends entirely on confirmation quality, risk management, and evidence from testing — not on the pattern itself. A breakout strategy with no volume filter, no retest logic, and a stop placed arbitrarily will bleed money to false breakouts regardless of how reliable the underlying pattern theory is.
What separates a profitable breakout strategy from a losing one is usually visible in backtested numbers before it ever reaches live trading: consistent risk-adjusted returns across many historical instances, not a few standout trades. One common way to judge this is the Sharpe ratio, a measure of return relative to volatility, where a strategy scoring above 1.0 is generally considered acceptable, above 2.0 very good, and above 3.0 excellent. A breakout strategy that only looks good on a handful of hand-picked chart examples but hasn't been tested this way isn't yet a system — it's a hypothesis.
Ready to trade breakouts systematically? Build your breakout rules as a visual deal map, backtest them on historical data, and see exactly where they trigger — no coding required with Quberas.