Breaker Block Trading: Spot, Trade & Automate
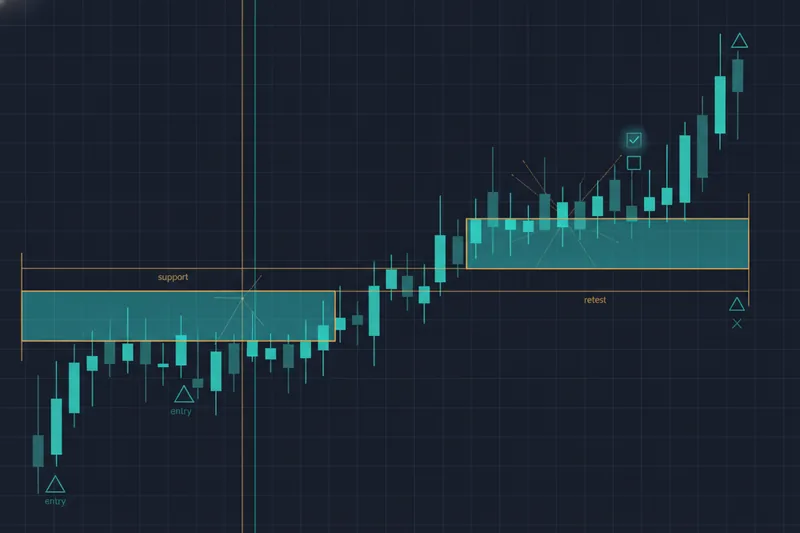
A breaker block is a former order block that failed to hold, forcing price through it and flipping its role from support to resistance (or vice versa) — and trading it systematically means converting that flip, its confirming retest, and its invalidation level into rules you can test before risking capital, rather than eyeballing it live. This guide covers what a breaker block is, how it forms, the bullish and bearish variants, how it differs from the order, rejection, and mitigation blocks it's often confused with, and how to turn the setup into a backtested strategy.
What Is a Breaker Block in Trading?
A breaker block is a price-action structure from ICT (Inner Circle Trader) concepts and the broader Smart Money Concepts (SMC) framework, which describes price behavior as a reflection of large institutional order flow rather than random movement. It starts life as an order block — the last opposing candle or zone before a sharp, impulsive move, marking where sizeable orders are believed to sit. When that order block fails to hold and price closes through it with force, triggering a market structure shift (also called change of character), the broken zone becomes a breaker block: a level that now works in the opposite direction to its original purpose. Traders who can already spot this on a chart but struggle to codify exactly when the flip counts as valid are the ones this concept is built for — it's the gap that a platform like Quberas is designed to close, by letting you define the zone and its trigger conditions visually instead of relying on a judgment call each time.
How Breaker Blocks Form: From Failed Order Block to Flip
The failed order block sequence
Every breaker block begins as a standard order block: price consolidates, then launches away from a zone, implying that resting orders there fueled the move. Under normal SMC logic, price should respect that zone on a future return. A breaker block forms when it doesn't — price returns to the order block and pushes straight through it instead of reversing.
The liquidity sweep that triggers the flip
That failure is rarely random. It usually coincides with a liquidity sweep — a move that clears out stop orders resting beyond a recent swing high or low, giving the market the fuel to break through. The combination of the sweep and the break produces the market structure shift: price makes a swing point in the opposite direction to the prevailing trend. Once that shift is confirmed, the failed order block's role reverses — this is the support and resistance flip that defines a breaker block: what was resistance becomes support, or what was support becomes resistance.
Bullish vs Bearish Breaker Blocks
Bullish breaker block characteristics
A bullish breaker block forms when a bearish order block fails: price sweeps liquidity below a prior swing low, then reverses upward through the order block with enough force to shift structure bullish. The broken zone now acts as support, and the bias is for continuation higher on a retest.
Bearish breaker block characteristics
A bearish breaker block is the mirror case: a bullish order block fails as price sweeps liquidity above a prior swing high, then reverses downward through it, flipping the zone into resistance. Which variant matters more depends on the prevailing trend, and in crypto markets that context can run long — bull-to-bear cycles have historically played out over roughly four-year spans rather than months, which is one reason a rules-based approach needs clear logic for both directions rather than a bias toward one.
Breaker Block vs Order Block vs Rejection Block vs Mitigation Block
These four SMC zones look similar on a chart but mark different events:
- Order Block — the origin zone: the last opposing candle before an impulsive move. It hasn't failed yet; it's simply the reference point.
- Rejection Block — marks a level where long wicks show price was rejected, but the zone itself wasn't broken or flipped. It's evidence of a reaction, not a structural failure.
- Mitigation Block — forms after a smaller, less aggressive pullback where smart money is thought to exit prior positions near breakeven, without a full liquidity sweep or structure break.
- Breaker Block — requires both a failed order block and a confirmed structure shift driven by a liquidity sweep. It's the only one of the four defined by an actual polarity flip.
The practical distinction: a rejection block tells you price reacted, a mitigation block tells you a position was likely closed, and a breaker block tells you the zone's job has changed. Confusing a mitigation block for a breaker block is a common source of low-quality entries, because the structural break that validates the trade never actually happened.
How to Trade Breaker Blocks: Step-by-Step Strategy
A tradable breaker block setup breaks down into four rule components:
- Entry condition — price must return to the breaker zone after the confirmed structure shift, not before it.
- Confirmation/retest — wait for price to react at the zone rather than entering on first touch.
- Stop-loss placement — anchored to the zone's invalidation point.
- Take-profit / exit logic — tied to the next liquidity level, not an arbitrary distance.
Confirming the retest before entry
The retest is where discretionary traders lose consistency, because "reacted" is subjective. A tighter rule is to require a lower-timeframe rejection candle, or a small change of character inside the zone, before treating the retest as valid. No-code strategy builders exist specifically to let traders encode this kind of conditional logic — price at zone, plus a confirming candle pattern, plus a directional bias — without writing code.
Placing stops and targets around the flipped zone
The stop-loss belongs beyond the extreme of the liquidity sweep that created the breaker block, not just beyond the zone itself — placing it inside the zone risks getting stopped out by normal retest noise. The target sits at the next meaningful liquidity pool: a prior swing high or low, or an opposing order block. Execution typically uses a limit or stop order to enter at the zone and a stop-loss order to define risk, the standard order types used across trading platforms.
Seeing Breaker Blocks Visually: Chart Zones and Debugging Your Rules
The hardest part of trading breaker blocks systematically isn't the concept — it's that "the zone flipped" and "the retest held" are visual judgments that don't translate cleanly into code. Quberas addresses this by letting you build the logic as a deal map: a visual sequence of entry, confirmation, stop, and exit stages connected the way you'd actually think through the trade. Each condition — price inside the zone, a liquidity sweep beyond a swing point, a confirming candle — is assembled in a condition builder that supports nested logic across price, volume, and indicators, rather than a single flat rule.
The payoff is the visual debugger: it highlights the exact chart zones tied to each condition, so you can see where your breaker block rule would have fired historically, not just where you think it should. Because it also shows near-miss cases — where a condition almost triggered but fell just short — you can tell whether your zone boundaries or sweep thresholds are too tight or too loose, and adjust them based on what actually happened on the chart instead of guessing.
Backtesting and Validating a Breaker Block Strategy
Automated trading tools broadly fall into four types: full coding environments, no-code/low-code builders, signal-to-execution layers, and marketplaces of pre-built bots. A no-code backtesting engine sits in the second category, letting a breaker block strategy be tested against historical OHLCV data without writing scripts — some alternative platforms offer similar validation but still require code such as Python to define the logic being tested.
What to check in a breaker block backtest
- Sample size across regimes — a breaker block strategy that only worked in one trending period isn't validated.
- Win rate against average risk:reward, not win rate alone — a lower win rate with a larger reward per win can still be the better edge.
- Drawdown behavior — note that drawdown can be measured differently depending on context (some frameworks track it end-of-day rather than on a trailing basis), so compare like for like across strategy variations.
- False-trigger rate — how often the zone conditions fired without a genuine structure shift following.
A backtest that looks strong is still only half the validation; forward testing on live but unfunded data is considered an equally necessary step before committing real capital, not an optional extra.
Common Mistakes and Risk Management When Trading Breaker Blocks
The most frequent error is treating every broken order block as a breaker block — a false breaker block happens when price pierces a zone without a genuine liquidity sweep or structure shift behind it, then reverses back through, stopping out anyone who entered on the flip alone. Waiting for confirmation, not just the break, filters most of these out.
On sizing, a useful discipline is the 3-5-7 rule: risk no more than 3% of capital on a single trade, cap total exposure across all open positions at 5%, and only take setups offering at least a 7% profit-to-loss ratio. Combined with strict stop-loss discipline — never widening a stop after entry because price is "close" to the zone — and a cooldown period after a stop-out to avoid re-entering on emotion rather than a fresh valid signal, these controls keep a single bad breaker block read from compounding into a bad trading day.
Breaker Block Trading FAQ
What is the 3-5-7 rule? A position-sizing guideline: risk 3% max per trade, 5% total across open positions, and target trades with at least a 7% profit-to-loss ratio.
Is trading breaker blocks legal? Yes — it's a technical analysis method based on public price data, no different legally from any other chart-based approach.
What's the main breakout risk? Entering on the initial break without confirmation; the zone can be pierced without a real structure shift, producing a false breaker block that reverses.
Rejection block vs breaker block? A rejection block marks a reaction without a structural break; a breaker block requires the zone to actually fail and flip polarity after a confirmed structure shift.
Build your breaker block rules visually and backtest them on historical data in Quberas — no coding required.